memory profiling
As a developer or user you sometimes want to find out where your code consumes memory. Or you suspect that the code "leaks memory", i.e., memory is not marked as available even after the data structures that occupy it are not longer needed. In Python there are a number of so-called memory profilers available. Here we introduce memory-profiler.
See the memory-profiler home page. Either from conda-forge
conda install -c conda-forge memory_profileror via pip
pip install -U memory_profilerIn short: Decorate functions with @profile and run your code with memory_profiler. Two convenient ways to do this:
- load the module during execution
python -m memory_profiler example.py- use the included
mprofscript and run
mprof run example.pyThis will create a line-by-line summary similar to line_profiler.
For other ways to run see memory-profiler.
You can also generate plots of the timeseries of memory usage with
mprof run example.py
mprof plotI tested the memory reader (in 0.19.2 on Python 3.6 on macOS) to see if there were some obvious memory leaks.
I use the script xtc_vs_memreader.py. The script loads the NhaA equilibrium dataset, which is about 1 GB in size (as compressed XTC). It first runs a simple analysis three times with the normal XTCReader. It then runs the same analysis another three times but first loads the trajectory into memory. (I load the whole trajectory ainto memory to stress the memory and then skip every 10th step during the analysis; for performance one would instead read every 10th step into memory and then analyze all frames.) This was run on a laptop with 8 GB of RAM and a SSD disk.
I used memory_profiler to obtain memory data:
mprof run xtc_vs_memreader.pyand
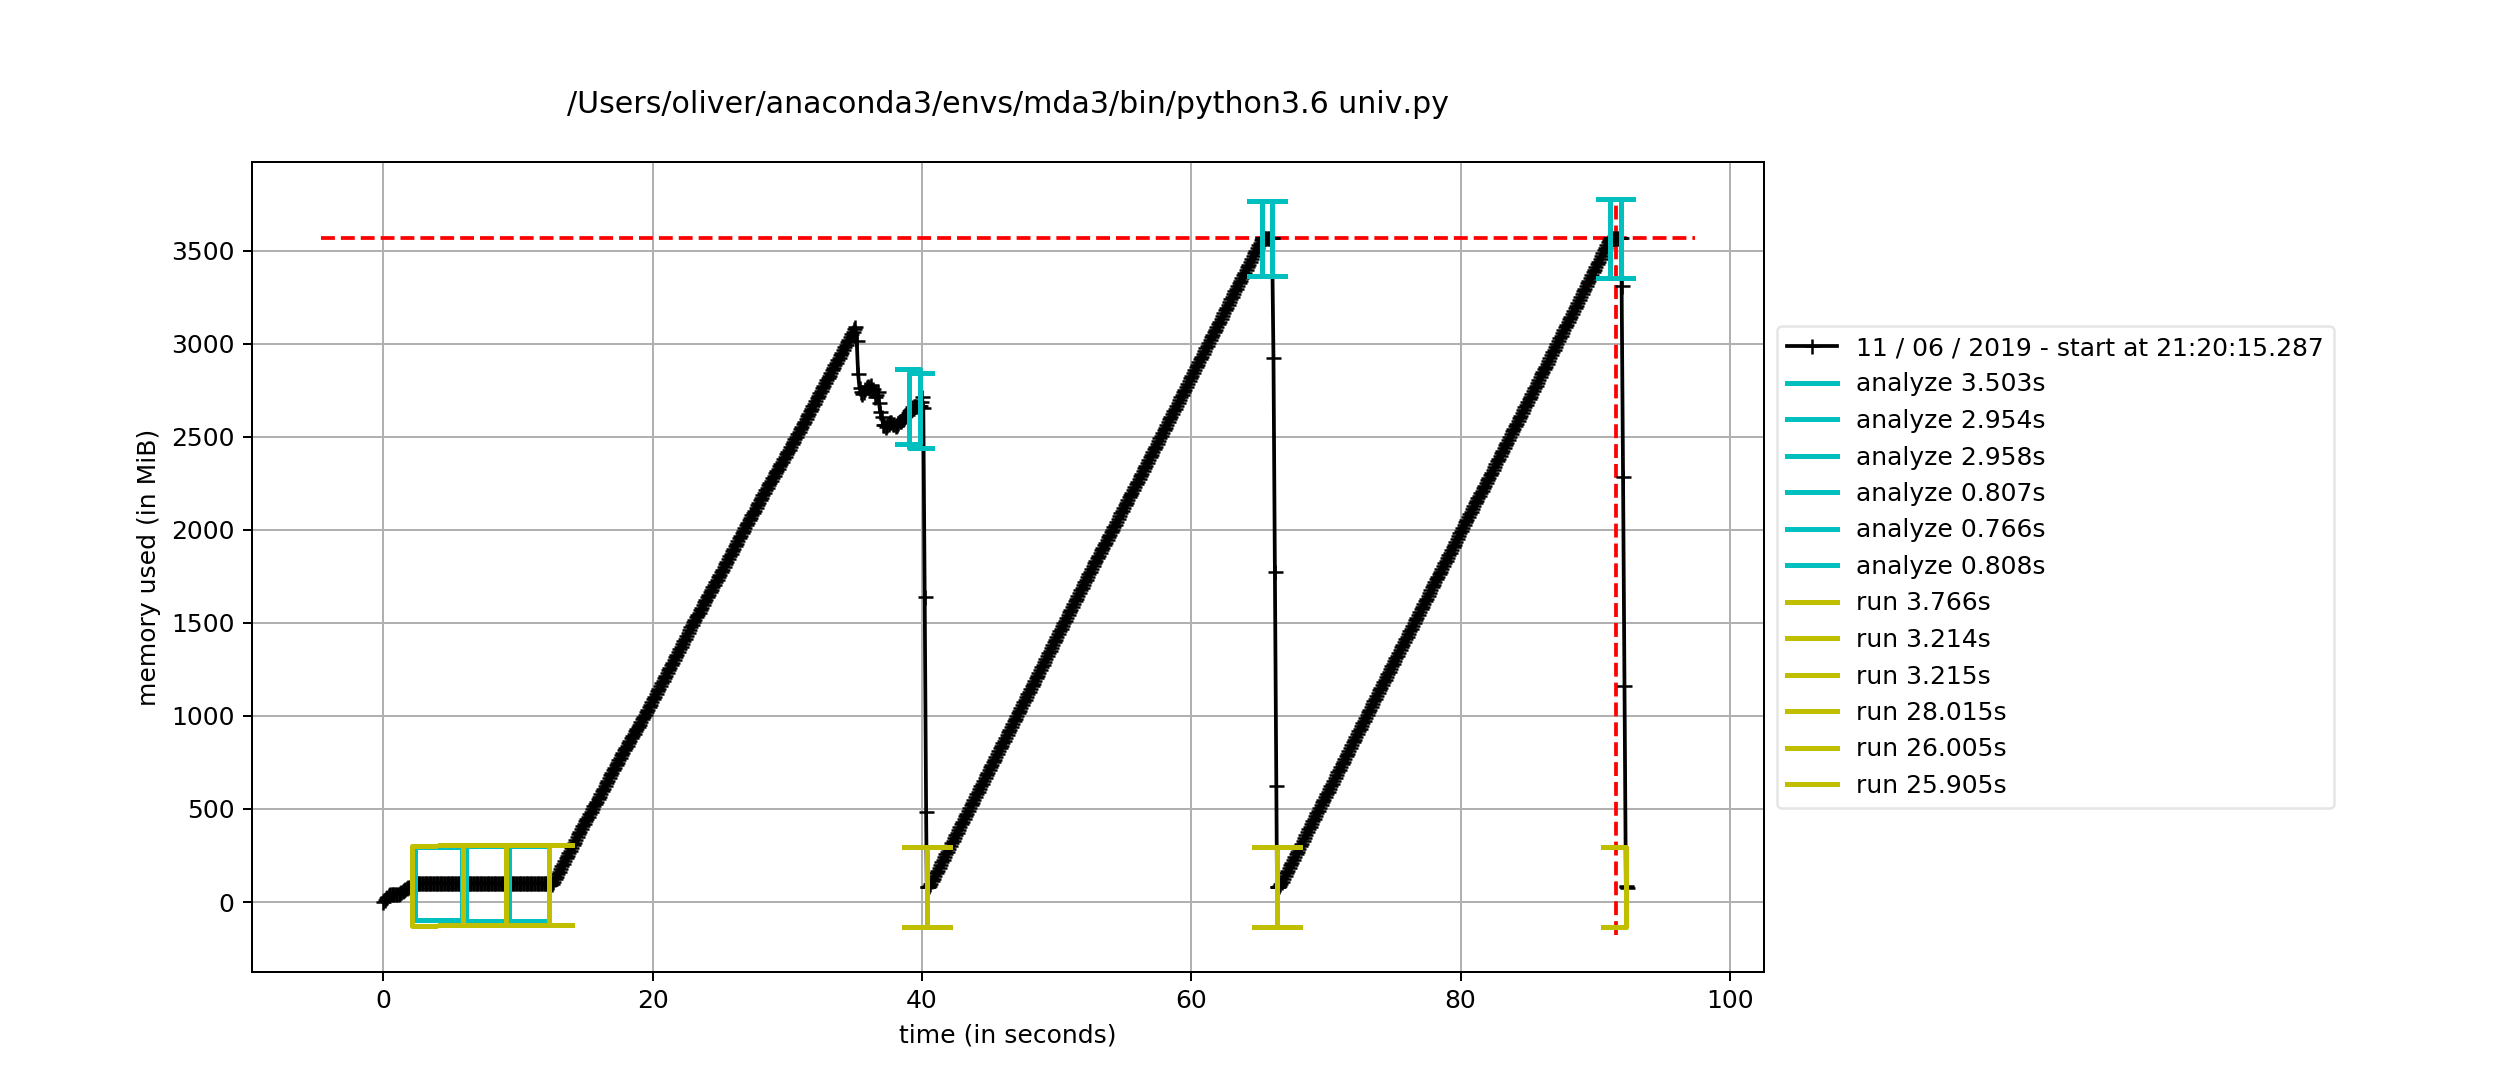
mprof plotOne can look at the line-by-line report but more interesting is the time course. The first one is with del u; gc.collect() enabled. The memory goes up when transfer_to_memory happens (in the run() function) and then goes down when I manually garbage collect.
The second one with automatic gc shows that python releases memory when it wants to... I don't understand why the total max memory is a bit different.
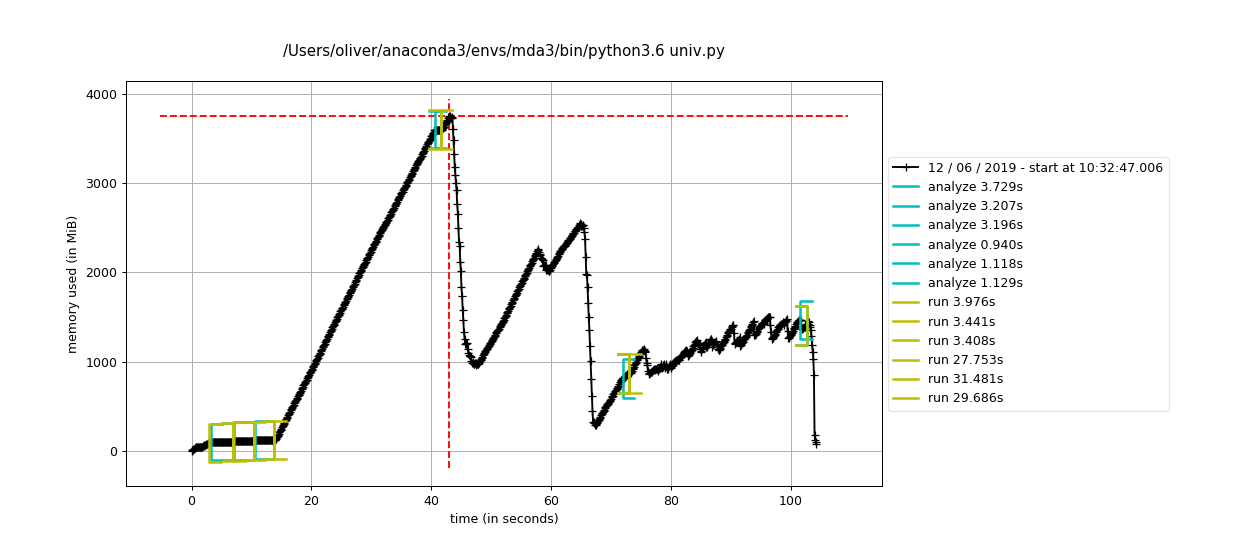
In both cases, however, it looks as if it releases (almost) all memory. I assume that the very small difference at the end has more got to do with the sampling interval of 0.1 s than a memory leak.
My conclusion from the simple test is that there's not a massive memory leak in the MemoryReader.