Collector already registered that provides name: executor_completed_tasks_total when using ExecutorServiceMetrics
#2426
Comments
|
@fzyzcjy Thanks for the issue. I tried to reproduce this with a sample project, but I couldn't reproduce it. Could you provide a sample project to reproduce it? |
|
@izeye I also find it VERY strange to reproduce :( If I do things like what you have done then no problem. But in my case it is mixed inside a big codebase... (examples of where I use it:) |
…gs to reproduce the issue

See micrometer-metrics/micrometer#2426
|
As far as I know, the only way to reproduce it is to create meters that have the same name but different sets of tags like izeye/sample-micrometer-spring-boot@7ca127a. @fzyzcjy Could you check if that's your case? |
|
@izeye Sorry that is not the case. I have also checked that but different from mine. Actually I can show you the full-text search result:
You see, I never put any tags there! |

|
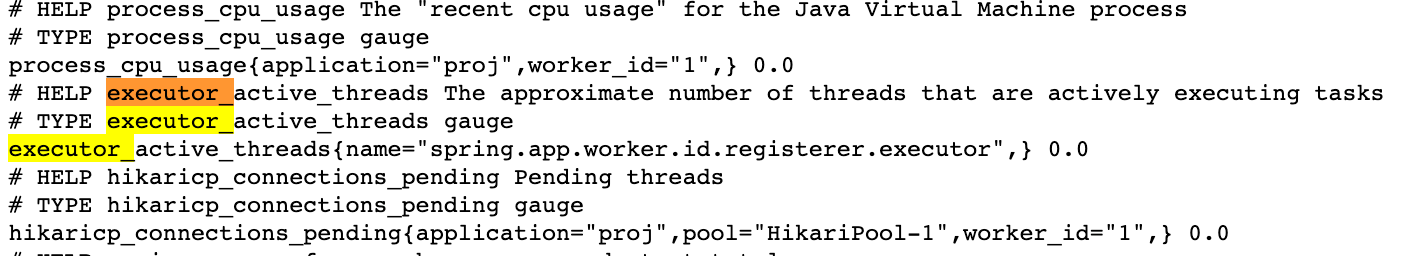
I have tried to print out logs, but no success. application.yml However, looking at my log, I only see: and no more logs... And here is the prometheus endpoint:
So it can be seen that, only On the other hand, you can see some lines of code are commented out. If I uncomment them, I see errors. EDIT: Even stranger things happen. Just now when I uncomment them, it goes well; but still, only one of the executors show metrics.
EDIT: Wait - I see the problem of that |

|
@fzyzcjy The limitation is specific to Prometheus, so you can log relevant meters by doing something similar to what I did in izeye/sample-micrometer-spring-boot@78228c6. |
|
@izeye Sounds great! I will have a try and reply to you. Thanks! |
|
Hmm I do only see the meter that appear in the endpoint. But no more... code: |
|
Even stranger. Just immediately after my call to new ExecutorServiceMetrics(), there is nothing related Meter. code result: |
|
@fzyzcjy Thanks for the further investigation. I'm not sure what's happening there at the moment. It would be helpful to allow me to understand it if you could share a sample project to reproduce it. Or you can debug it with the exception. |
|
@izeye Thanks for the reply! Unfortunately I cannot create a minimum reproducible sample... It seems to only have error in such mixed and complicated environment :(
I am willing to debug. But I have not seen any Exceptions. And no logs either (e.g. |
|
@fzyzcjy The opening comment includes a stack trace, so I think you can debug with it to see what's going on. |
|
@izeye That's another problem... And actually that stack contains almost nothing - just tell us that the name already exists... Is there any way I can see more insights (more logs) of micrometer? |
|
@fzyzcjy Sorry, there's nothing I can advise without a sample project at the moment. |
|
@izeye I mean more logs. I have tried to set level to TRACE without any more logs... As we know more logging means more possibility to debug successfully |
|
Is it possible that there is code triggering an initial meter being registered, then the subsequent meter is registered (that errors), there are common tags or a filters adding the extra tag? |
|
@checketts Sorry I do not quite understand the situation you described. I do not add common tags, except using this code: |
|
Can you remove those common tags and see if the error goes away? (Just as a test, we can add them back later) My theory is that something is registering an executor's meters very early in the application's lifecycle before the common tags are taking effect. Then once they take effect, you are registering the other executor and the tags aren't aligning at that point (which causes the error) |
|
@checketts No the error does not go away... I comment out that |
|
I do see the problem!! @izeye @checketts Suggestion for improvements (only need several lines of code)
What is the problemLook at my code above. Then that class Thank you all the same for your help. |
|
Now you understand the problem would you be interested in creating a simple project that replicates it so we can understand your recommendation better? |
|
@checketts Sure. Just two lines of code: You can put it to whereever you like, for example, it seems that @izeye has some good unit test repos. P.S. You may need dependency for Spring Cloud Sleuth. Just follow their install tips, very simple to install and understand. Or have a brief look at this tutorial |
* Log ExecutorServiceMetrics.bindTo() failure

See gh-2426

* Fix a wrong class reference for a logger

Co-authored-by: Jonatan Ivanov <jonatan.ivanov@gmail.com>

* Use conventional order for modifiers

Co-authored-by: Jonatan Ivanov <jonatan.ivanov@gmail.com>

Co-authored-by: Jonatan Ivanov <jonatan.ivanov@gmail.com>
|
Thanks everyone for all the investigation and suggestion and change from this. I'm a little confused about the latest state of this, though. Is the original exception no longer an issue? The added logging won't change whether such an exception happens or not. Do we need to do anything still for this issue? |
|
If the original exception isn't an issue anymore, perhaps we can focus resolving this issue on making sure it is possible and clear how to get traces with Sleuth and metrics with Micrometer from the same ExecutorService? |
|
@shakuzen For me, the original issue disappears after changing configurations. Thanks for everyone! |
|
Just to follow-up, if you wanted to trace and get metrics from an executor service and its submitted tasks using Sleuth and Micrometer, you can make your @Bean
ExecutorService myExecutorService(MeterRegistry meterRegistry) {
return ExecutorServiceMetrics.monitor(meterRegistry, Executors.newSingleThreadScheduledExecutor(), "myExecutorService");
}And Sleuth will take care of tracing it in auto-configuration. |
It can be unclear why metrics are missing when passing a wrapped type, as the API seems to indicate any `Executor` or `ExecutorService` can be monitored. This makes explicit the types we can monitor and notes unwrapping should be done by the user, since we cannot know wrapper types from external code.

See gh-2443 and gh-2426
Hi thanks for the lib! I am facing a problem: I have several
ExecutorServices, and want to monitor their metrics. I use code like the following:However, it throws the following error:
What should I do? Thanks!
The text was updated successfully, but these errors were encountered: