
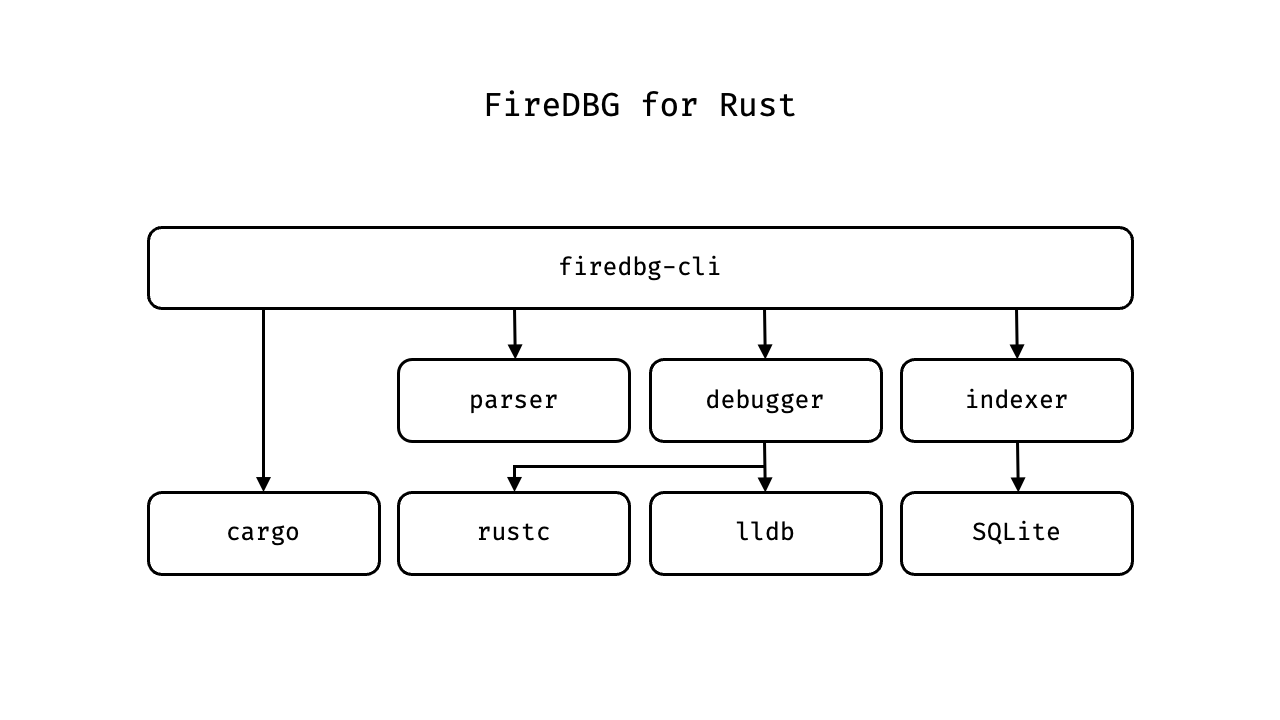
For more information on the architecture of FireDBG, please read Architecture of FireDBG.
lldb binding; forked from codelldb
FireDBG command line interface
Debugging engine of FireDBG
Transforms .firedbg.ss into .sqlite file
FireDBG Support Library
Parses source files in workspace
Event stream protocol of .firedbg.ss
firedbg-cli is a CLI to invoke all FireDBG operations.
The firedbg command can only act on Cargo Workspace. If you have a simple dependency free rust file, you still need to put it under a cargo workspace for firedbg to work properly.
There are two ways to tell firedbg where is the root directory of a cargo workspace:
- By default, the current directory will be the root directory of a cargo workspace
- Or, overriding it with
--workspace-rootoption, i.e.firedbg --workspace-root <WORKSPACE-ROOT>
cache: Parse all.rssource files in the current workspaceclean: Cleanup thefiredbg/folderlist-target: List all runnable targetsrun: Run a binary target with debugging enabledexample: Run an example with debugging enabledtest: Run an integrated test with debugging enabledunit-test: Run a unit test with debugging enabledindex: Run indexer on the latest run and save it as a.sqlitedb filelist-run: List allfiredbgrunsopen: Open debugger view in VS Codehelp: Print help message or the help of the given subcommand(s)
You can get the help messages by appending the --help flag.
By default FireDBG will only trace the function calls of the debugging package. If you want to trace other packages in your local workspace, you will need to create a firedbg.toml config file on your workspace root.
[workspace.members]
quicksort = { trace = "full" }
# Syntax: <PACKAGE> = { trace = "<full | none>" }Based on syn.
firedbg-rust-parser is a Rust source code parser. It can parse a Rust source file, walk the abstract syntax tree of Rust, then produce a list of breakpoints for the debugger to pause the program at the beginning of every function call.
We will walk the Rust AST, syn::Item, and collect all forms of function / method:
- Free standalone function,
syn::Item::Fn - Impl function,
syn::Item::Impl - Trait default function,
syn::Item::Trait - Impl trait function,
syn::Item::Impl - Nested function, walking the
syn::Itemrecursively - Function defined inside inline module,
syn::Item::Mod
A span is a region of source code, denoted by a ranged line and column number tuple, along with macro expansion information. It allows the debugger to set a breakpoint at the correct location. The debugger will set the breakpoint either at the start or the end of the breakable span.
fn func() -> i32 {
/*                ^-- Start of Breakable Span: (Line 1, Column 19)  */
    let mut i = 0;
/*  ^-- End of Breakable Span: (Line 3, Column 5)  */
    for _ in (1..10) {
        i += 1;
    }
    i
}The current implementation is rudimentary, but we get exactly what we need. We considered embedding Rust Analyzer, for a few advantages: 1) to get the fully-qualified type names 2) to traverse the static call graph. The problem is resource usage: we'd end up running the compiler frontend thrice (by cargo, by language server, by firedbg).
The FireDBG Event Stream is serialized according to the SeaStreamer File Format, which by convention has the .ss extension.
The Protocol defines the different streams and formats of the messages on top of the file format, and thus they have the .firedbg.ss extension.
The file format is not tightly-coupled with the stream protocol, as it is possible to stream to/from a different backend, e.g. Redis.
There are currently 4 streams:
| Stream Key | Format | Description |
|---|---|---|
info |
Json | DebuggerInfo: debugger version, debug target, arguments and exit code, etc |
file |
Json | SourceFile: relative path to the source file |
breakpoint |
Json | Breakpoint: breakpoints created and the source location |
event |
Binary | Event: function call, function return, etc |
firedbg-stream-indexer is a streaming indexer. It can stream events from .firedbg.ss files, index them in real-time, and write updates to .sqlite incrementally.
There are 4 event types:
| Event Code | Event Type | Description |
|---|---|---|
B |
Breakpoint | e.g. a breakpoint hit by fire::dbg! |
P |
Panic | Program panic |
F |
Function Call | - |
R |
Function Return | - |
The indexer reconstructs the call stack for each thread from the event stream, and write a parent_frame_id for each F event.
The indexer also deserializes the value blobs and translates them into JSON. The JSON is then transformed into pretty-printed Rust-like value strings:
Value Blob -> RValue -> Lifted RValue -> Pretty PrintThe database schema can be found under indexer/src/entity/, which is defined by a set of SeaORM entities.
Highly recommend you to install a SQLite extension for VS Code. You can find some sample indexes in the Testbench.
Based on lldb.
This library is semver exempt. The version number is intended to track rustc's version.
Configuration can be set via the FIREDBG_RUST_CONFIG environment variable. e.g. FIREDBG_RUST_CONFIG=MAX_ARRAY_SIZE=100;DONT_TRACE_ALLOCATION
| Key | Type | Description |
|---|---|---|
MAX_ARRAY_SIZE |
usize |
Maximum number of items in array, string and other containers |
RECURSIVE_DEREF_LIMIT |
usize |
Recursive limit; i.e. this limits the depth of a binary tree |
KEEP_HASH_ORDER |
bool |
If set, don't sort hash maps by hash key |
DONT_TRACE_ALLOCATION |
bool |
If set, don't trace heap allocations |
Currently supports x64 (aka amd64) and arm64 (aka aarch64). There are quite some assembly parsing and register fiddling catered to each platform. There are some assumptions to pointers being 8 bytes in the codebase. It requires considerable effort to support a new architecture, but we are open to commercial collaboration.
There is no OS specific code for now. lldb is used on both Linux and macOS. But on macOS we'd connect to the host's lldb-server.
If we decided to support Windows natively, we'd need to make a Windows backend.
The debugger binary must be compiled for the same platform as the target binary.
In addition, we assume they both use the same rustc (not necessarily exactly the same, but ABI compatible with each other).
We intend to build-in all handling of standard library types. For HashMap, frozen-hashbrown is used.
In the future, we want to open scripting interface (maybe via rhai) to handle vendor library types (e.g. DateTime, Decimal), in a similar sense to Natvis.
The format for serializing Rust values can be best understood by reading SourceReader::read_values() in reader.rs.
It should be pretty straight-forward, the only tricky part is ReaderContext which is for resolving memory references.
This is highly architecture specific. We try to capture the return value at the moment the function returns, i.e. at the ret instruction. Not everything is on the stack, sometimes the return value will be passed through registers.
According to Rust's ABI convention, it means if the return value is:
-
One or two primitives, each no bigger than 64 bits. This includes
(i64, i64)andstruct { a: i64, b: i64 }. -
One
i128/u128; will be split intorax/rdx -
One or two
f32/f64; will be put inxmm0/xmm1 -
Option<T>andResult<T, E>; whereT&Eis no bigger than 64 bitsThe enum discriminant is in
rax, where:Type T E OptionSome = 1None = 0ResultOk = 0Err = 1and the
T/Ewill be inrdx.
Unfortunately it is much more complicated than the above summary. Right now the implementation is all mess, and completely based on heuristics.
If we got the chance to do this properly, may be we can generate rust code and inspect the assembly (systematically).
Say our return type is (T, F):
fn probe() -> (T, F) { todo!() }
fn extractor() {
    let res = probe();
    std::hint::black_box(&res);
}
If we disassemble the binary, we should see:
extractor:
call probe
mov ..
call black_box
So between probe and black_box, there would be some memory fiddling, which would end up writing the full struct onto the stack, where the address will then be stored in rax / x0.
There should be better ways to do this, if you have an idea please open a discussion thread!
Right now it is still a WIP. We can trace all Box, Rc, Arc allocations now, so that we are able to extract the content of Box<dyn T>.
The TODO is to trace deallocations and output the information to a dedicated event stream.
This macro allows you to capture the value of a variable via runtime inspection in FireDBG.
Usage example:
use firedbg_lib::fire;

fn some_fn(v: i32) -> i32 {
    fire::dbg!(v) + 1
}

fn other_fn(v: i32) -> i32 {
    fire::dbg!("arg_v", v) + 1
}
Which fire::dbg!(v) would expand to __firedbg_trace__("v", v) when compiled under debug mode.
The label could be customized, which fire::dbg!("arg_v", v) would expand to __firedbg_trace__("arg_v", v).
In release mode, it would expand to an expression passing through the value, i.e. { v }.
Note that the function passes through the ownership of the variable, just like the std::dbg! macro.
fn __firedbg_trace__<T>(name: &'static str, v: T) -> T { v }- Heap allocation tracing
- Async Rust support
Licensed under either of
- Apache License, Version 2.0 (LICENSE-APACHE or http://www.apache.org/licenses/LICENSE-2.0)
- MIT license (LICENSE-MIT or http://opensource.org/licenses/MIT)
at your option.
Any contribution intentionally submitted for inclusion in the work by you, as defined in the Apache-2.0 license, shall be dual licensed as above, without any additional terms or conditions.