| Name:Version | Documentation | Purpose | Alternatives | Advantages |
|---|---|---|---|---|
| Terraform 1.5.4 | Docs | Hardware Provisioner Initial Setup |
Salt Ansible |
1. Easy syntax 2. Sufficient community and documentation 3. Much better suited for hardware provisioning |
| Hetzner Provider 1.42.1 | Docs | Deploying servers | Vultr DigitalOcean |
1. Cheaper :) 2. Good community overlooking provider |
| Ansible 2.15.2 | Docs | Automating Tasks | Salt |
1. No footprint on target hosts |
| Ubuntu 22.04 | Docs | Operating system | Debian Centos |
1. Bigger community 2. Faster releases than debian 3. Bigger community than any other OS 4. Not cash grapping like centos (Yet :)) |
| Victoriametrics latest | Docs | Time-series Database | InfluxDB Prometheus |
1. High performance 2. Cost-effective 3. Scalable 4. Handles massive volumes of data 5. Good community and documentation |
| vmalert latest | Docs | Evaluating Alerting Rules | Prometheus Alertmanager |
1. Works well with VictoriaMetrics 2. Supports different datasource types |
| vmagent latest | Docs | Collecting Time-series Data | Prometheus |
1. Works well with VictoriaMetrics 2. Supports different data source types |
| Alertmanager latest | Docs | Handling Alerts | ElastAlert Grafana Alerts |
1. Handles alerts from multiple client applications 2. Deduplicates, groups, and routes alerts 3. Can be plugged to multiple endpoints (Slack, Email, Telegram, Squadcast, ...) |
| Grafana latest | Docs | Monitoring and Observability | Prometheus Datadog New Relic |
1. Create, explore, and share dashboards with ease 2.Huge community and documentation 3. Easy to setup and manage 4. Many out of the box solutions for visualization |
| Clickhouse latest | Docs | Super fast colomn based database | Casandra Postgresql sql |
1. Supremely fast for OLAP 2. Good set of replication engines for every need 3. Able to handle two data sets with the same primary key (mergetree) |
| Nodeexporter latest | Docs | Hardware and OS Metrics | cAdvisor Collectd |
1. Measure various machine resources 2. Pluggable metric collectors 3. Basic standard for node monitoing |
| Clickhouse Keeper latest | Docs | System cordinator, DDL handling, Metadata keeper | Zookeper |
1. Perfect integration with clickhouse 2. Uses up much less ram 3. Configuration is compatible with zookeper which makes the migration a lot easier |
| Docker latest | Docs | Application Deployment and Management | containerd podman |
1. Much more bells and wistels are included out of the box comparing to alternatives 2. Awsome community and documentation 3. Easy to work with |
Note Each ansible role has a general and a specific Readme file. It is encouraged to read them before firing off
p.s: Start with the readme file of main setup playbook
- Create an Api on hetzner
- Create a server as terraform and ansible provisioner (Needless to say that ansible and terraform must be installed)
- Clone the project
- In modular_terraform folder create a terraform.tfvars
- The file must contain the following variables
- hcloud_token "APIKEY"
- image_name = "ubuntu-22.04"
- server_type = "cpx31"
- location = "hel1"
- The file must contain the following variables
- Run terraform init to create the required lock file
- Before firing off, run terraform plan to see if everything is alright
- Run terraform apply
- Go Drink a cup of coffe and come back in 10 minutes or so (Hopefully everything must be up and running by then (: )
- No automation for scaling or maintenance (after the initial set up)
- Terraform is limited to Hetzner
- Grafana datasource must be set manually http://IP_ADDRESS_:8428
- Run the following command for terraform to install dependencies and create the lock file
terraform init- Run the following command and check if there are any problems with terraform
terraform plan- Apply terraform modules and get started
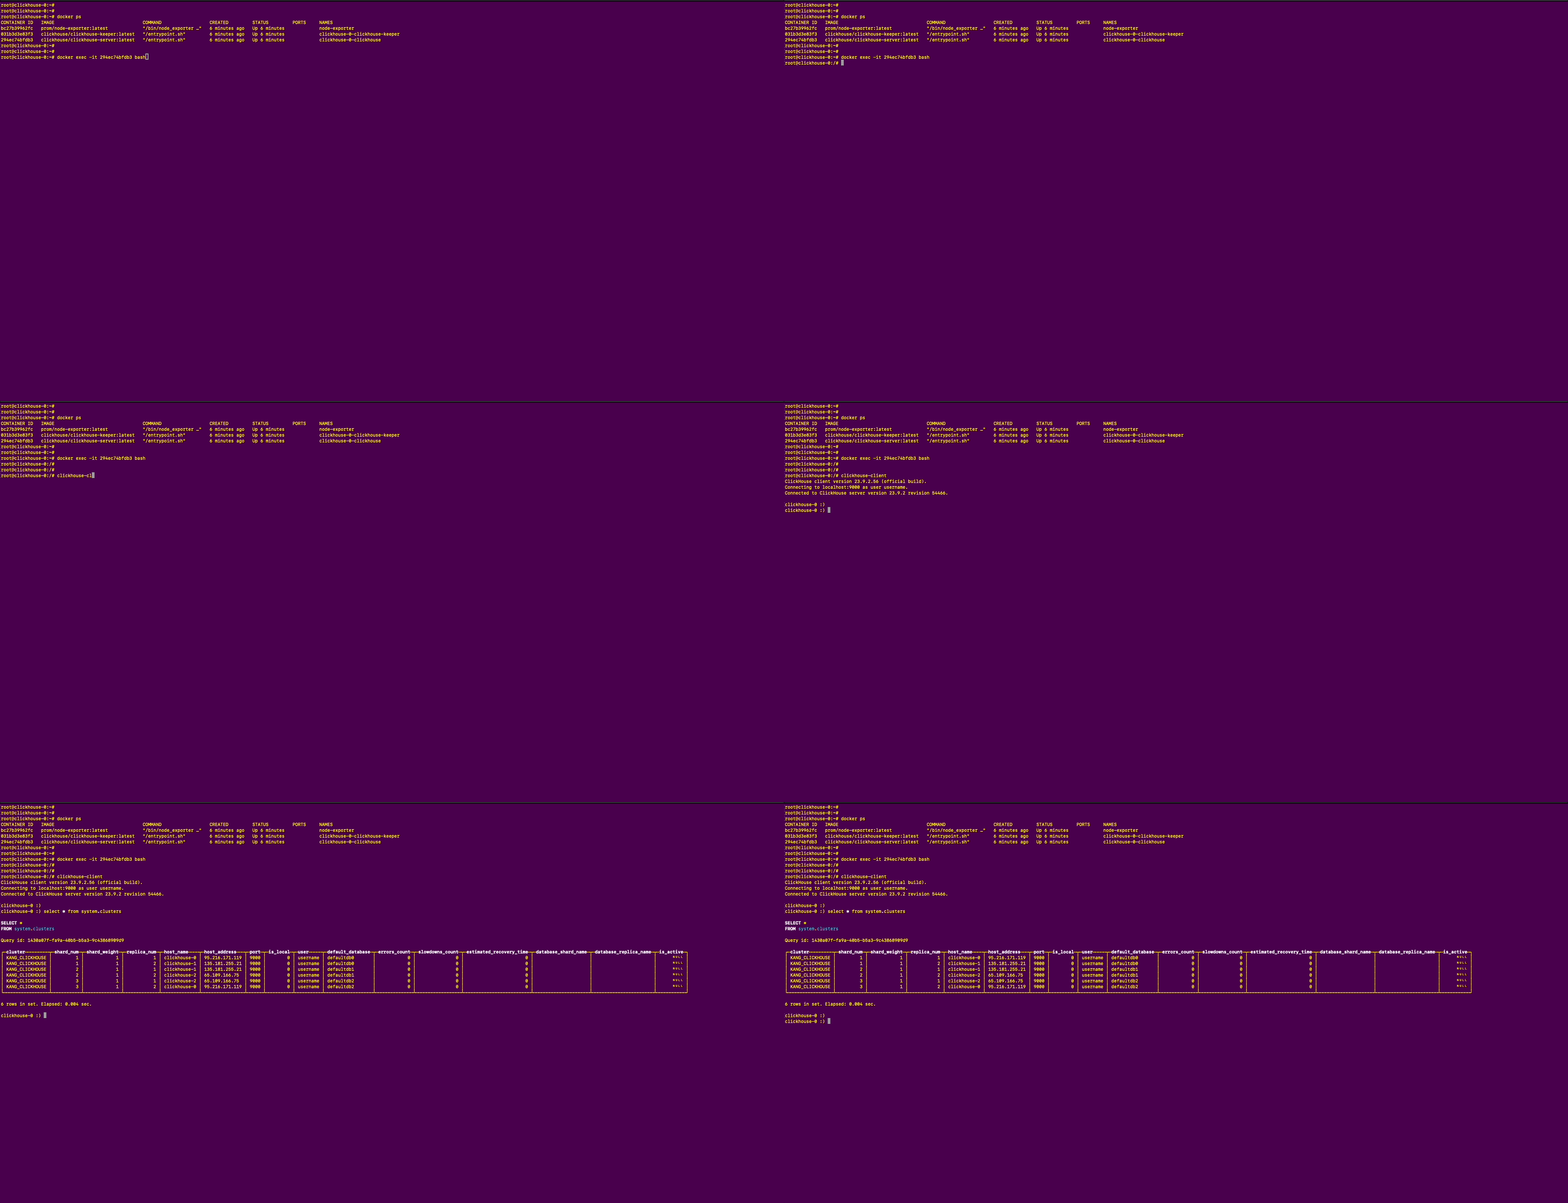
terraform apply- Check the replication schema on clickhouse cluster
clickhouse-client
select * from system.clusters- Check the replication schema on clickhouse cluster
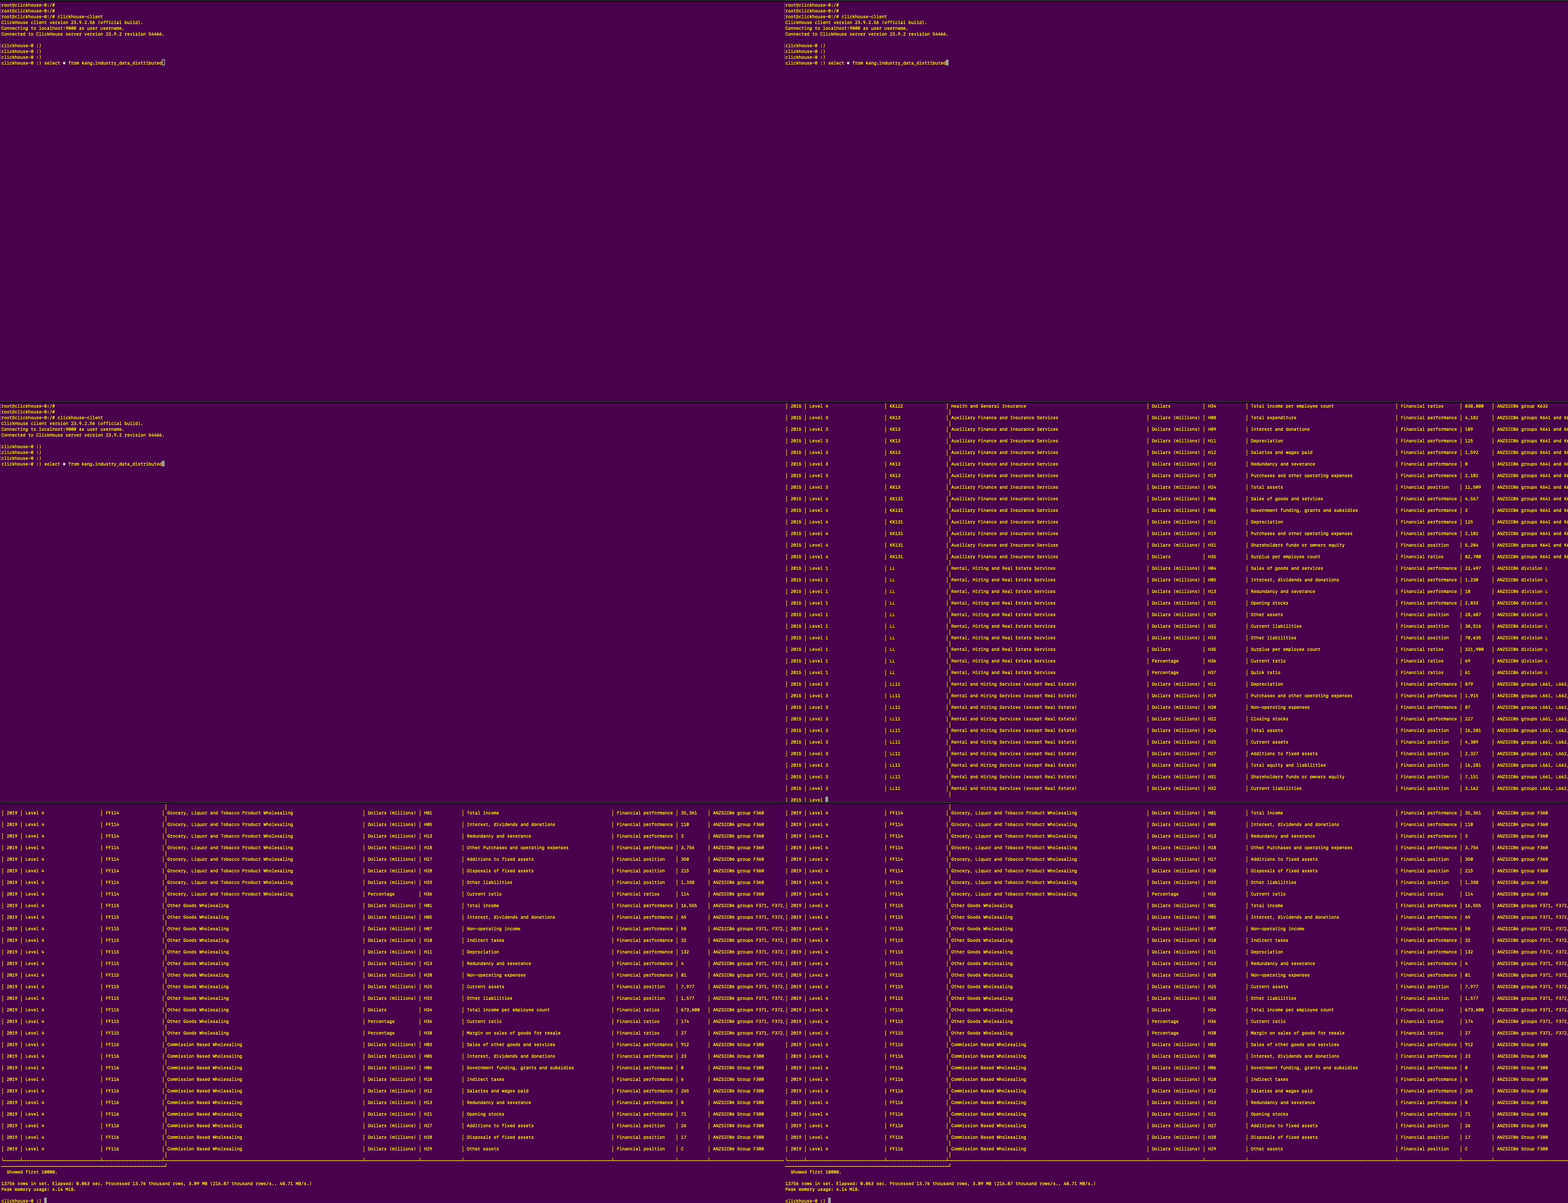
clickhouse-client
select * from kang.industry_data_distributed
Note Keep in mind that because of the replication engine which is being used in the demo db, each node only returns the chunk of data which it has and not the whole thing
- Checking the monitoring stack
Note All dashboard are provisioned To add custom dashbaord on load, add it to /Ansible/roles/Victoria_Metrics/files/Grafana/provisioning/dashboards as a .json file. It would automatically be loaded to Grafana Just keep in mind that you have to also copy the dashbaord using ansible to the remote destination
- To Clean up everything (including the nodes themselvs)
terraform destroy


