Stress results comparator tool
This tool is designed to be able to make specific comparisons between different data sets (in CSV format) and to plot them in order to visualize the comparison.
In order to make use of this script, the following python dependencies must be installed.
pandas
matplotlib
prettytable
These dependencies can be installed via pip, although if you have installed the wazuh-qa framework, you will already have them installed by default.
In case you have the framework installed, you can make use of this tool by typing the command stress_results comparator <args> directly, or, failing that, execute the corresponding python file.
It works very simply, just run stress_results_comparator <parameters>:
The following example shows how to generate a comparison, along with graphs on two data sets that have different number of rows.
stress_results_comparator -f DEV_ubuntu_agent.csv 4.4_ubuntu_agent.csv -l DEV 4.4 -s cpu memory -d modulesd --force -p
2022-10-12 16:41:24,536 — INFO — Reducing dataframe from DEV_ubuntu_agent.csv: before 16757 --> after 16736 rows
2022-10-12 16:41:24,536 — INFO — Reducing dataframe from 4.4_ubuntu_agent.csv: before 16736 --> after 16736 rows
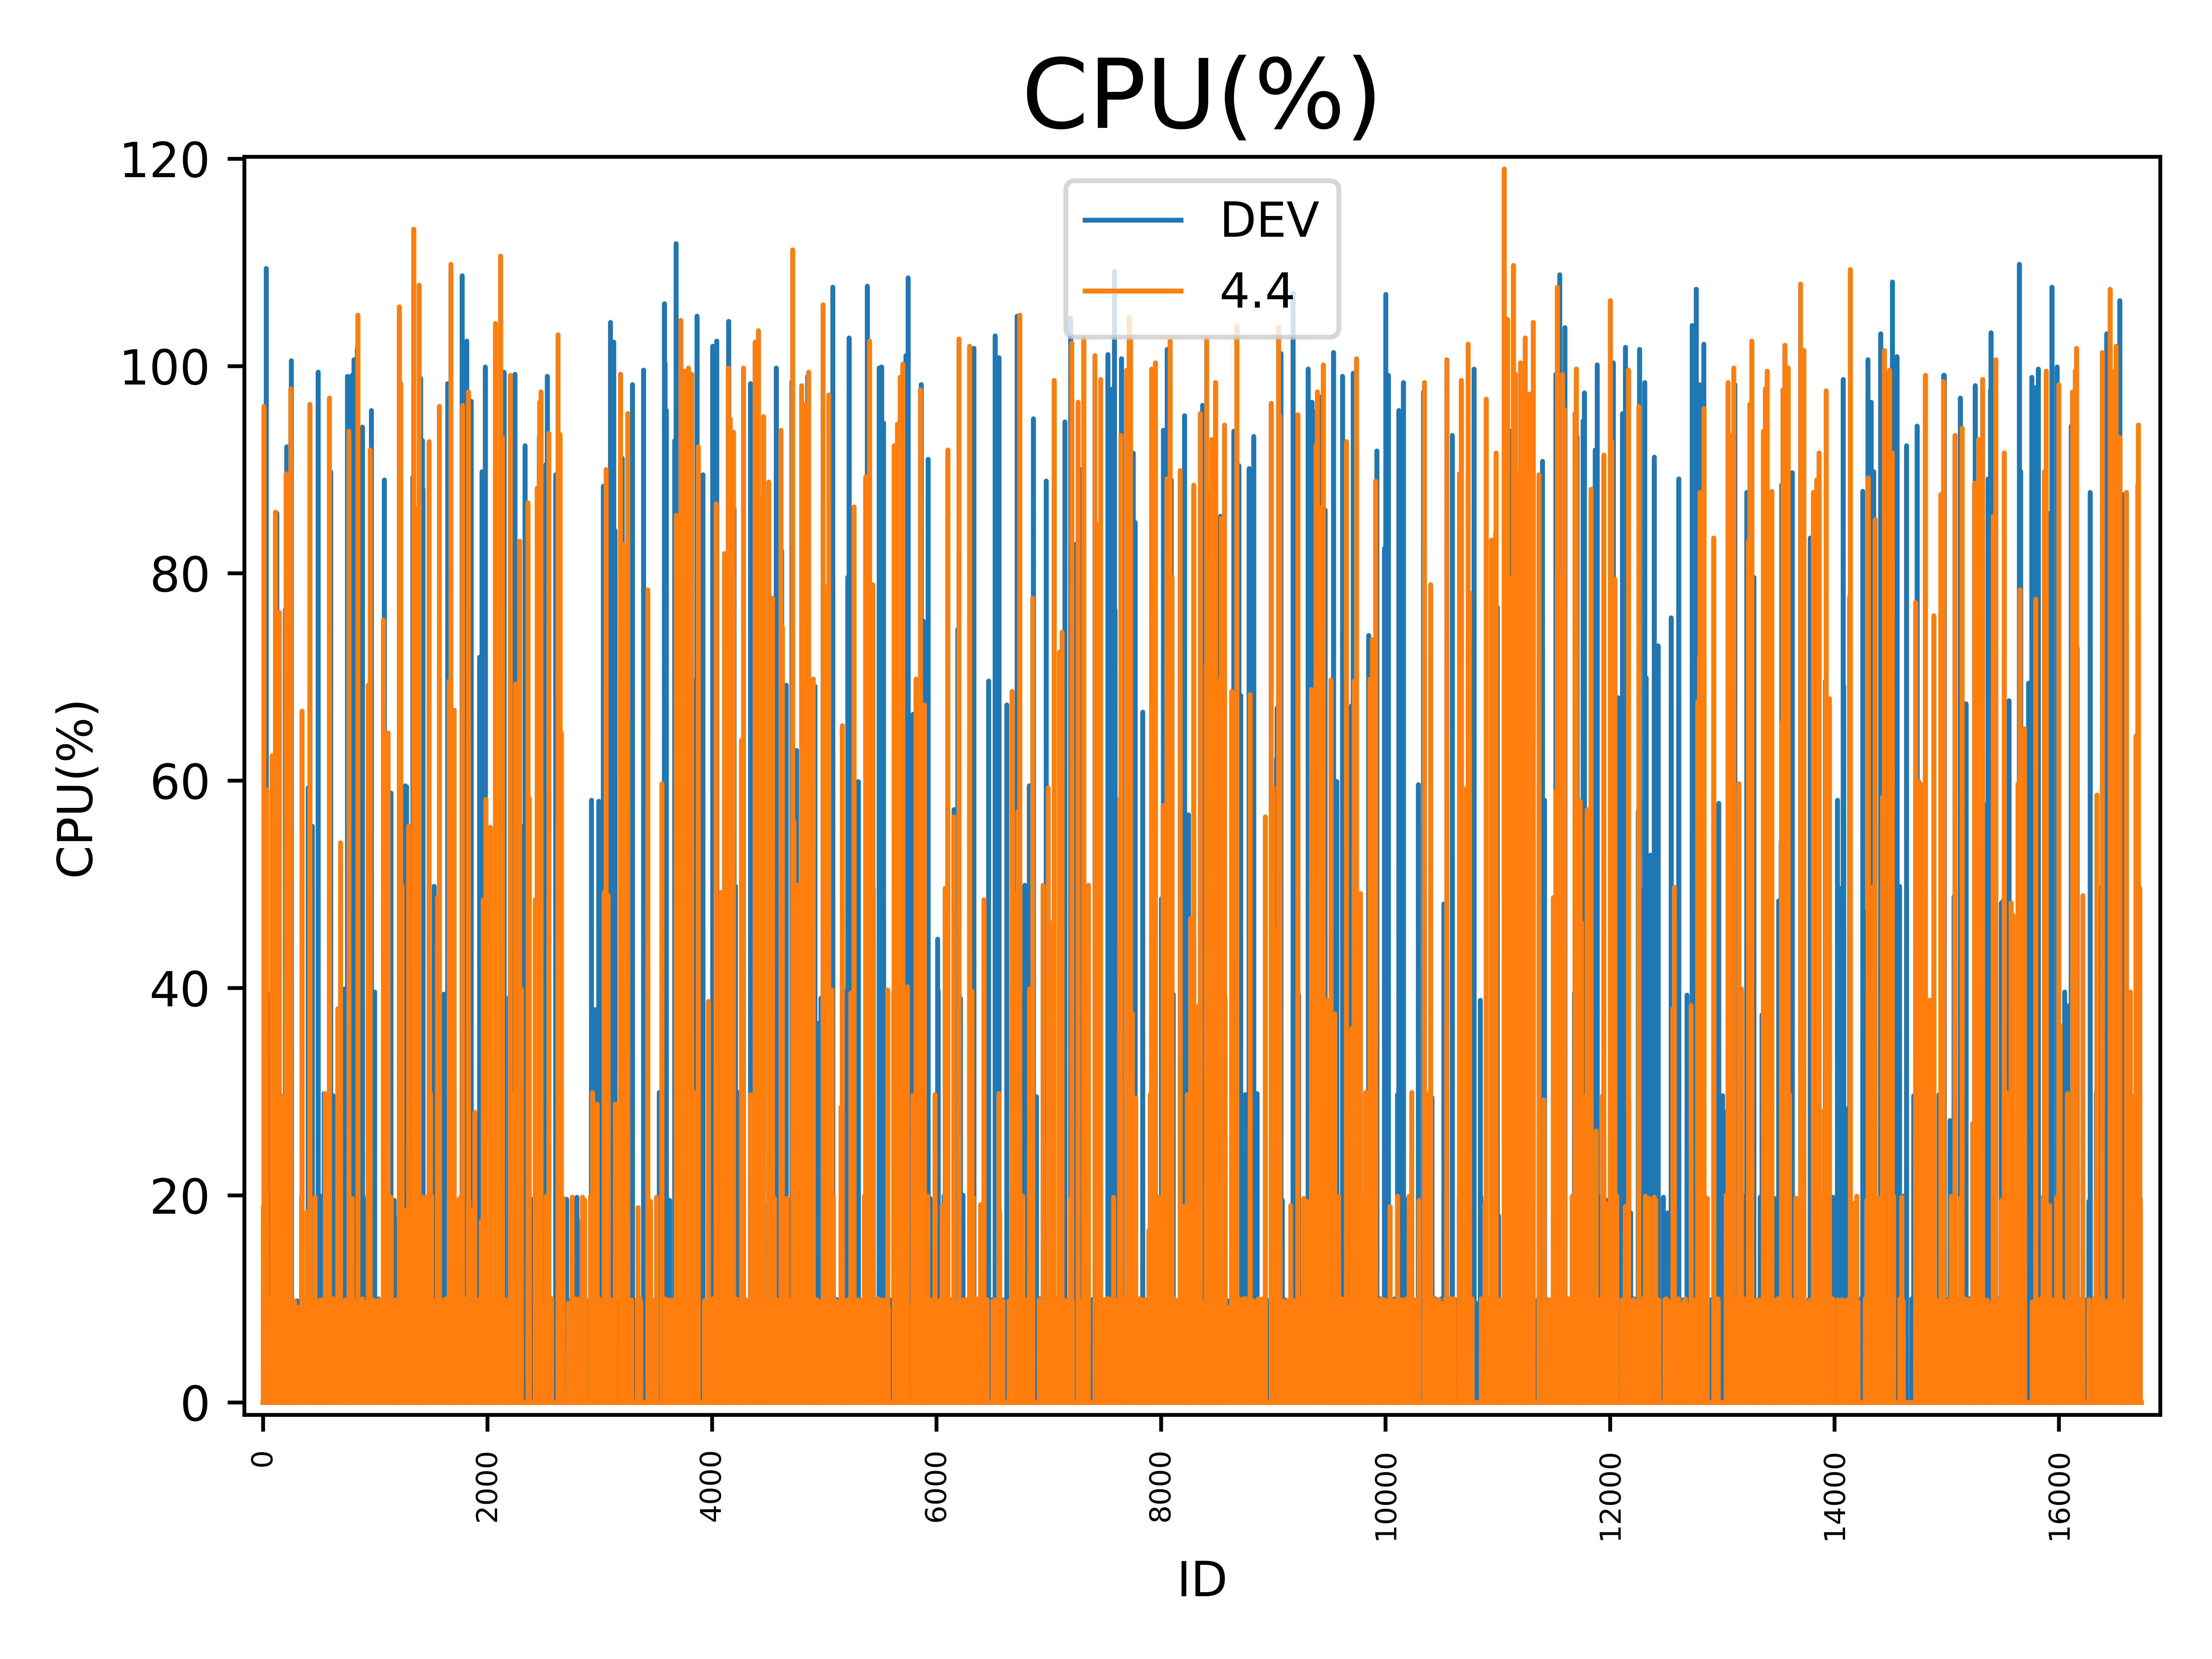
+-------------------------------------+
| CPU(%) |
+------+------+-----------+-----------+
| Name | Mean | Max value | Min value |
+------+------+-----------+-----------+
| DEV | 2.1 | 111.8 | 0.0 |
| 4.4 | 2.1 | 119.0 | 0.0 |
+------+------+-----------+-----------+
+----------------------------------------+
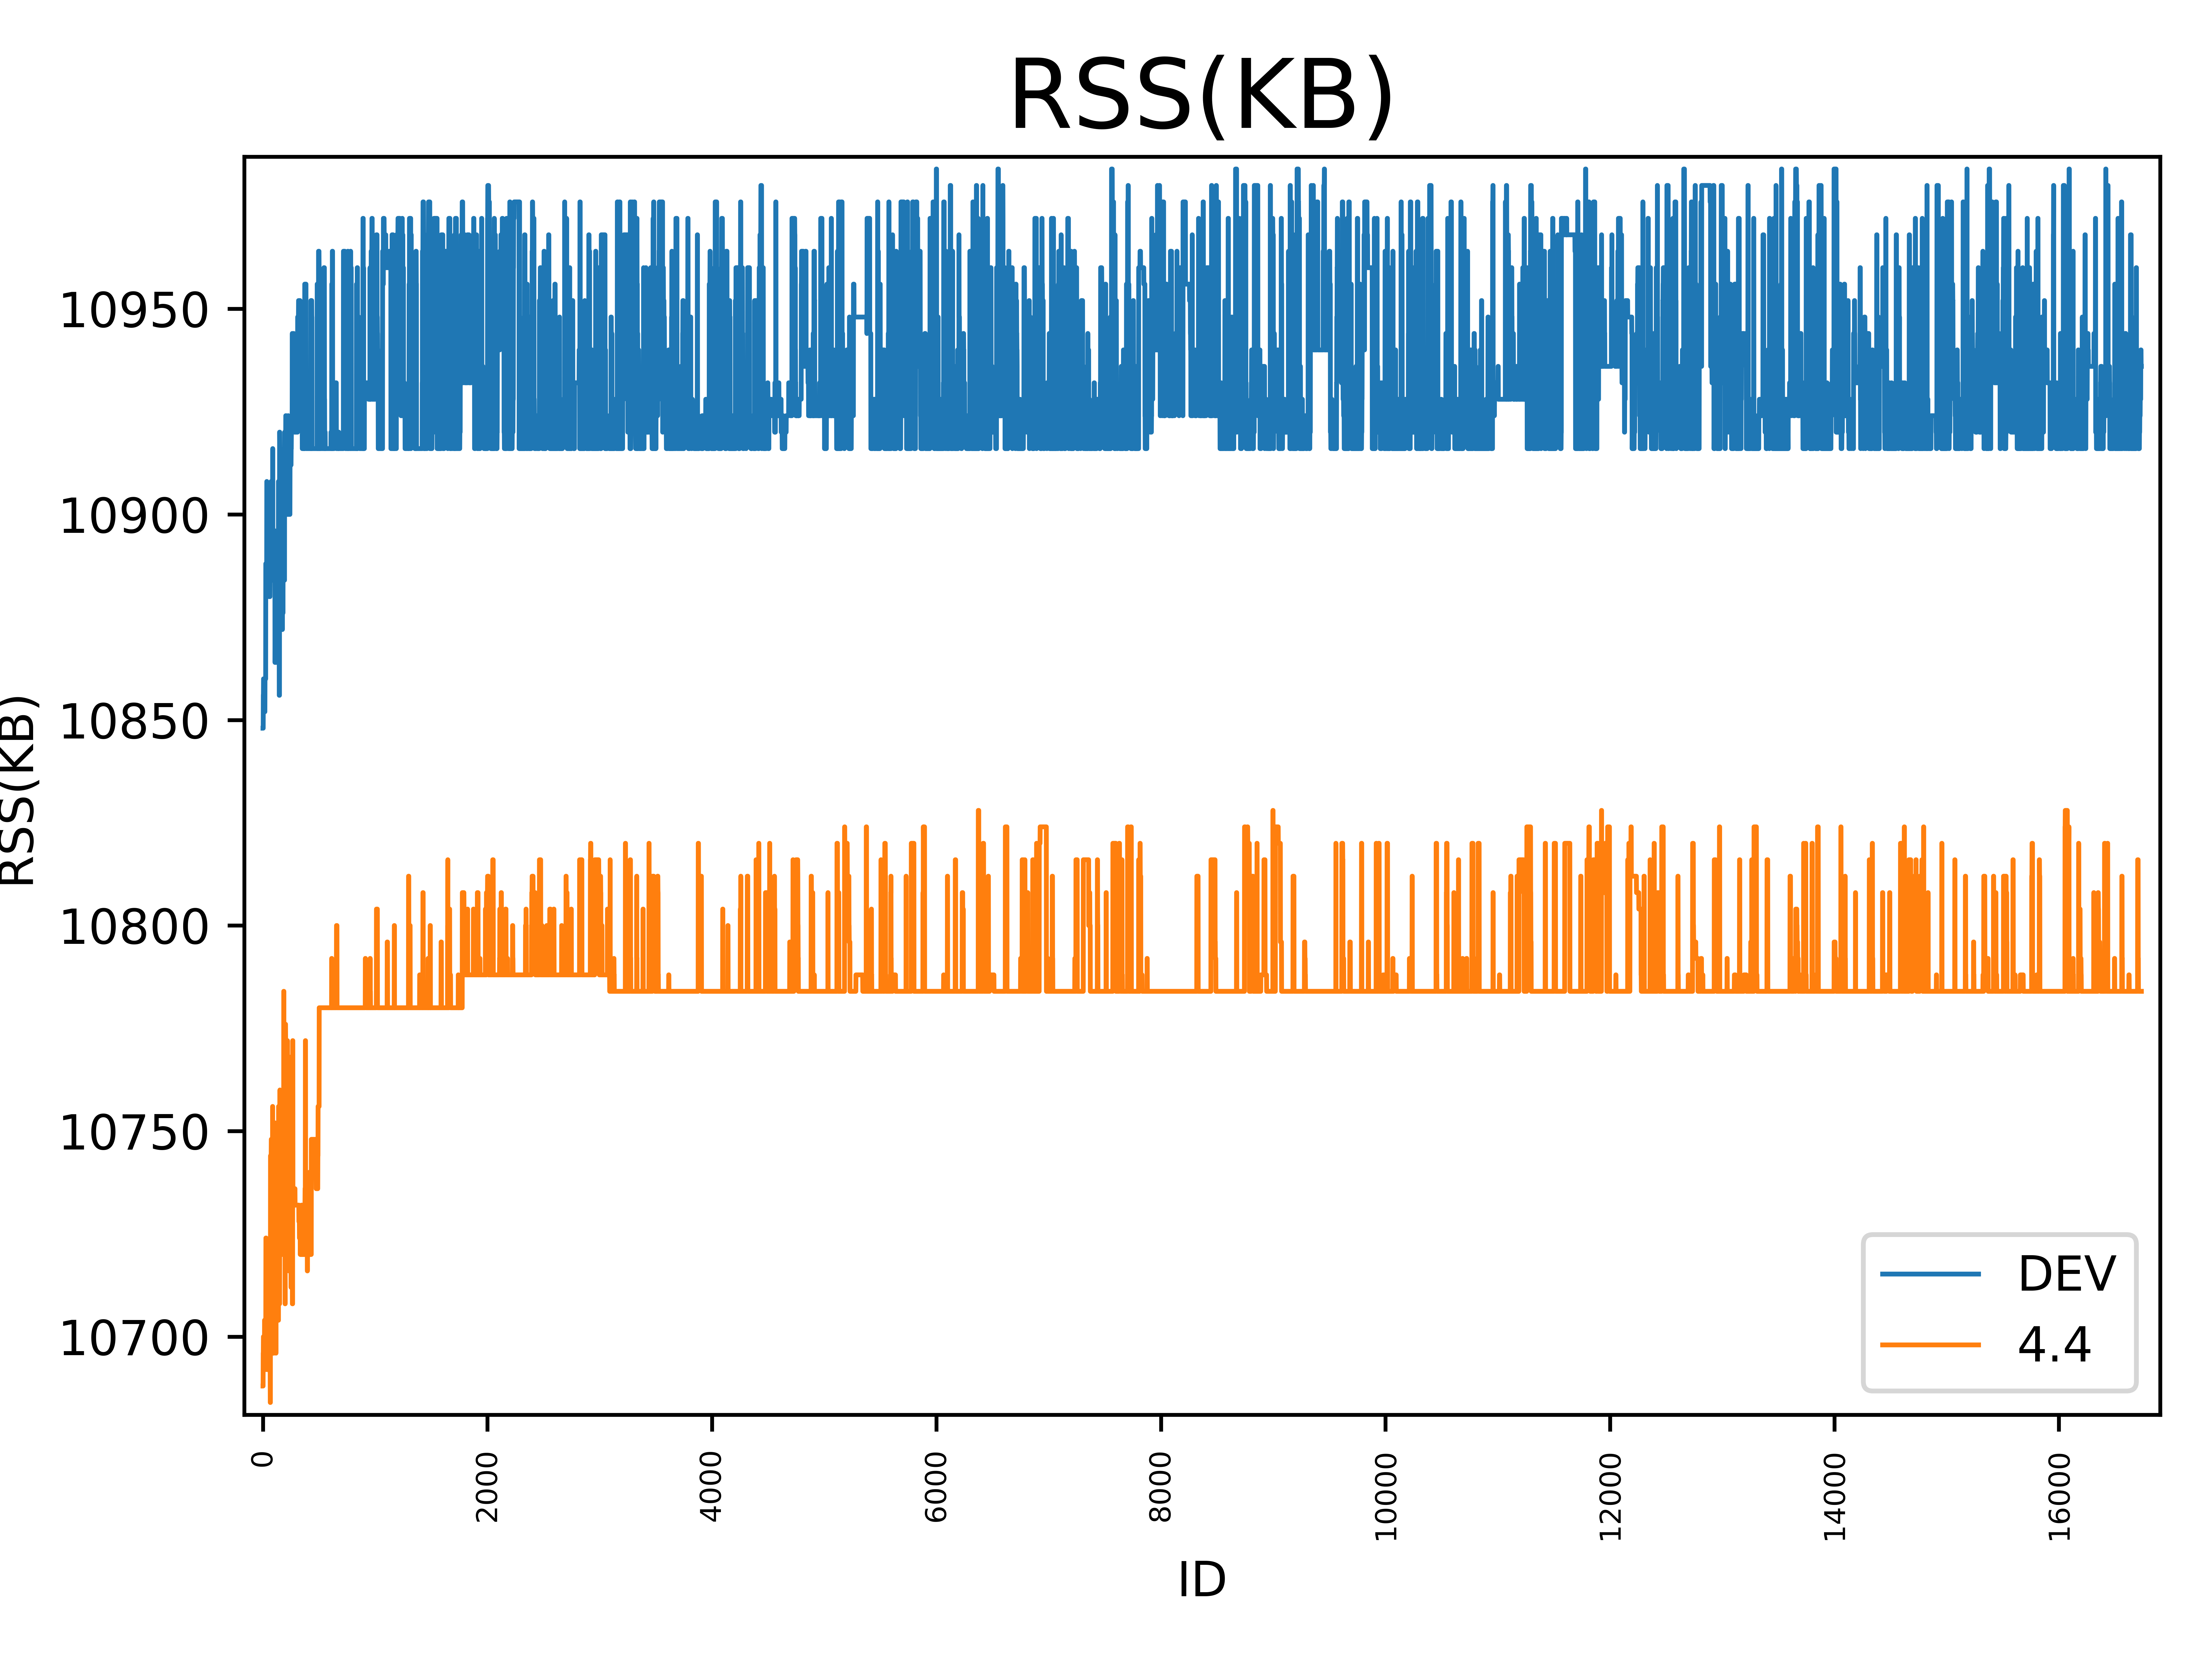
| RSS(KB) |
+------+---------+-----------+-----------+
| Name | Mean | Max value | Min value |
+------+---------+-----------+-----------+
| DEV | 10932.3 | 10984.0 | 10848.0 |
| 4.4 | 10785.8 | 10828.0 | 10684.0 |
+------+---------+-----------+-----------+
2022-10-12 16:41:24,836 — INFO — Generating /home/jmv74211/Desktop/dev/20221012164124_cpu_comparison.png plot ...
2022-10-12 16:41:27,862 — INFO — Generating /home/jmv74211/Desktop/dev/20221012164124_memory_comparison.png plot ...
| Parameter | Objective | Required | Default | Type |
|---|---|---|---|---|
| -d --daemon | Daemon to select and compare from dataset | True | None | str |
| -f --files | Data files to compare (separated by space) | True | None | str |
| -l --labels | Labels to assign to each data file | True | None | str |
| -s --stats | Selected stats to compare (separated by space) | False | ['cpu', 'memory'] | str |
| -o --output | Output path to save the comparation figures | False | current-working-dir | str |
| --force | Force comparison of data even though they have different numbers of rows | False | None | None |
| -p --plots | Activate the graphic generation for comparison results | False | None | None |
| -d --debug | Activate DEBUG logging | False | None | None |
Notes
-
You have to specify as many labels as datasets. These labels will be used to identify the compared dataset.
-
A graph will be generated (if specified in the parameters) for each statistic compared.
-
If you have datasets with different numbers of rows, you can use the
--forceparameter to adjust their size (it does not edit original data files) to make a comparison with the same number of elements. The firstnvalues of each dataset will be taken, withnbeing the minimum of the sizes of each dataset.
Parameters restrictions
-
-d --daemonmust be one of the following list:['agentd', 'logcollector', 'syscheckd', 'modulesd', 'execd', 'agent.exe', 'remoted', 'analysisd', 'wazuh-db', 'wazuh-authd', 'clusterd', 'monitord', 'integratord', 'maild', 'logcollector', 'syscheckd', 'modulesd', 'execd'] -
-s --statsmust be one of the following dictionary:Note: On the left the value to be entered, and on the right the value it represents within the data set.
'cpu': 'CPU(%)',
'memory': 'RSS(KB)',
'disk_read': 'Disk_Read(B)',
'disk_written': 'Disk_Written(B)',
'virtual_memory': 'VMS(KB)',
'file_descriptor': 'FD',
'read_ops': 'Read_Ops',
'write_ops': 'Write_Ops',
'disk_usage': 'Disk(%)',
'uss': 'USS(KB)',
'pss': 'PSS(KB)',
'swap': 'SWAP(KB)',
'remoted_queue_size': 'Queue size',
'remoted_total_queue_size': 'Total Queue size',
'remoted_tcp_sessions': 'TCP sessions',
'remoted_events_count': 'Events count',
'remoted_control_messages': 'Control messages',
'remoted_discarded_messages': 'Discarded messages',
'remoted_messages_sent': 'Messages sent',
'remoted_bytes_received': 'Bytes received',
'analysisd_total_events': 'Total Events',
'analysisd_syscheck_events_decoded': 'Syscheck Events Decoded',
'analysisd_syscheck_edps': 'Syscheck EDPS',
'analysisd_syscollector_events_decoded': 'Syscollector Events Decoded',
'analysisd_syscollector_edps': 'Syscollector EDPS',
'analysisd_rootcheck_events_decoded': 'Rootcheck Events Decoded',
'analysisd_rootcheck_edps': 'Rootcheck EDPS',
'analysisd_sca_events_decoded': 'SCA Events Decoded',
'analysisd_sca_edps': 'SCA EDPS',
'analysisd_hostinfo_events_decoded': 'HostInfo Events Decoded',
'analysisd_hostinfo_edps': 'HostInfo EDPS',
'analysisd_winevt_events_decoded': 'WinEvt Events Decoded',
'analysisd_winevt_edps': 'WinEvt EDPS',
'analysisd_other_events_decoded': 'Other Events Decoded',
'analysisd_other_edps': 'Other EDPS',
'analysisd_events_processed': 'Events processed (Rule matching)',
'analysisd_events_edps': 'Events EDPS (Rule matching)',
'analysisd_events_received': 'Events received',
'analysisd_events_dropped': 'Events dropped',
'analysisd_syscheck_queue': 'Syscheck queue',
'analysisd_syscollector_queue': 'Syscollector queue',
'analysisd_rootcheck_queue': 'Rootcheck queue',
'analysisd_sca_queue': 'SCA queue',
'analysisd_hostinfo_queue': 'Hostinfo queue',
'analysisd_winevt_queue': 'Winevt queue',
'analysisd_event_queue': 'Event queue',
'analysisd_rule_matching_queue': 'Rule matching queue',
'analysisd_alerts_log_queue': 'Alerts log queue',
'analysisd_firewall_log_queue': 'Firewall log queue',
'analysisd_statistical_log_queue': 'Statistical log queue',
'analysisd_archives_log_queue': 'Archives log queue',
'analysisd_alerts_written': 'Alerts written',
'analysisd_firewall_alerts_written': 'Firewall alerts written',
'analysisd_fts_alerts_written': 'FTS alerts written',
'agentd_status': 'Status',
'agentd_last_keepalive': 'Last Keepalive',
'agentd_last_ack': 'Last ACK',
'agentd_generated_events_number': 'Number of generated events',
'agentd_messages_number': 'Number of messages',
'agentd_buffered_events_number': 'Number of events buffered'
Default mode, which displays the results in tabular form:
+----------------------------------------+
|                RSS(KB)                 |
+------+---------+-----------+-----------+
| Name |   Mean  | Max value | Min value |
+------+---------+-----------+-----------+
| DEV  | 10932.3 |  10984.0  |  10848.0  |
| 4.4  | 10785.8 |  10828.0  |  10684.0  |
+------+---------+-----------+-----------+
To generate graphs, the argument -p must be added. In this way, in addition to the results table, images with the graphs will be generated.
+----------------------------------------+
|                RSS(KB)                 |
+------+---------+-----------+-----------+
| Name |   Mean  | Max value | Min value |
+------+---------+-----------+-----------+
| DEV  | 10932.3 |  10984.0  |  10848.0  |
| 4.4  | 10785.8 |  10828.0  |  10684.0  |
+------+---------+-----------+-----------+
- Compare CPU and memory usage of
modulesddaemons between 2 different versions (with plots)
stress_results_comparator -f data_1.csv data_2.csv -l 4.4 4.3 -s cpu memory -d modulesd -p
- Compare
analysisdtotal events between 3 different versions (without plots)
stress_results_comparator -f data_1.csv data_2.csv data_3.csv -l 4.4 4.3 4.2 -s analysisd_total_events -d analysisd
- Compare
remotedbytes received between 2 different versions in custom path (CSV files have different number of rows)
stress_results_comparator -f data_1.csv data_2.csv -l Dev Production -s remoted_bytes_received -d remoted --force -p -o /tmp/custom_path