Debugging Verdaccio
This guidelines are meant to help you to debug verdaccio, you can debug a production version (installed from npm or docker) or the source code available on this repository. Feel free to amend changes on this document via issues or discussions.
Be aware of the two branches for development, the
5.xstands for the version 5 and stable, the master branch stands for the6.xnext version which is released as alpha and not ready for production.
-
Install globally verdaccio.
npm install -g verdaccio@latest -
Figure out where is installed verdaccio
which verdaccio
/home/xxxx/.nvm/versions/node/v14.17.4/bin/verdaccio
- Run the inspector with verdaccio
node --inspect /home/xxxx/.nvm/versions/node/v14.17.4/bin/verdaccio
If you don't know where verdaccio is located, in UNIX use witch, for example node --inspect $(which verdaccio)
If the error is happening on start up, use --inspect-brk instead to stop in the first line of execution.
- Attach the debugger, it could be with chrome via
chrome://inspect/#devicesor Visual Code.
There are two ways to increase the verbose code with a docker image:
- Increasing logger to
traceordebug - Add the environment variable
DEBUG=verdaccio*
If you want to debug your own plugins, see the following docker examples.
Run
docker run -p 4873:4873 -p 9229:9229 -e NODE_OPTIONS='--inspect-brk=0.0.0.0' verdaccio/verdaccio
Open Chrome Dev Tools and load chrome://inspect/#devices and start debugging.
Similar to this example, create a folder with two files, the config.yaml and the Dockerfile with this content.
FROM verdaccio/verdaccio:5

ADD docker.yaml /verdaccio/conf/config.yaml
Build the image with docker build -t verdaccio/verdaccio:local . and then run it docker run -it --rm --name verdaccio -p 4873:4873 verdaccio/verdaccio:local or with debug code.
docker run -it --rm --name verdaccio -e DEBUG='verdaccio*' -p 4873:4873 verdaccio/verdaccio:local
or also could be added directly within the Dockerfile.
FROM verdaccio/verdaccio:5
ENV DEBUG=verdaccio*
ADD docker.yaml /verdaccio/conf/config.yaml
An aditional way if you need to map folders with docker is using docker-compose.yaml for instancethis example.
Verdaccio uses debug to get more verbose detail what's happening on the server.
DEBUG=verdaccio* node /home/xxxx/.nvm/versions/node/v14.17.4/bin/verdaccio
or
DEBUG=verdaccio* verdaccio
In version 5.x (branch) just run
-
yarn install(not neeed it but just in case) - Run debugger
-
yarn start(with babel-node) -
DEBUG=verdaccio* yarn start:debug(with @babel/register)
-
In version 6.x (master branch`):
This version is based in modules, so build step is required for debug.
pnpm install
pnpm build
pnpm debug
both options uses behind the hoods uses babel-node --inspect, the next step is attach the debugger.
Let's imagine you want to debug packages/store/test/storage.spec.ts.
- Go to the target pagage.
- Run
node --inspect-brk ../../node_modules/jest/bin/jest.js packages/store/test/storage.spec.ts - Launch on vcode the debug
Attachto capture the debug session - Set some breakpoints in the code
That should be enough to debug an unit test.
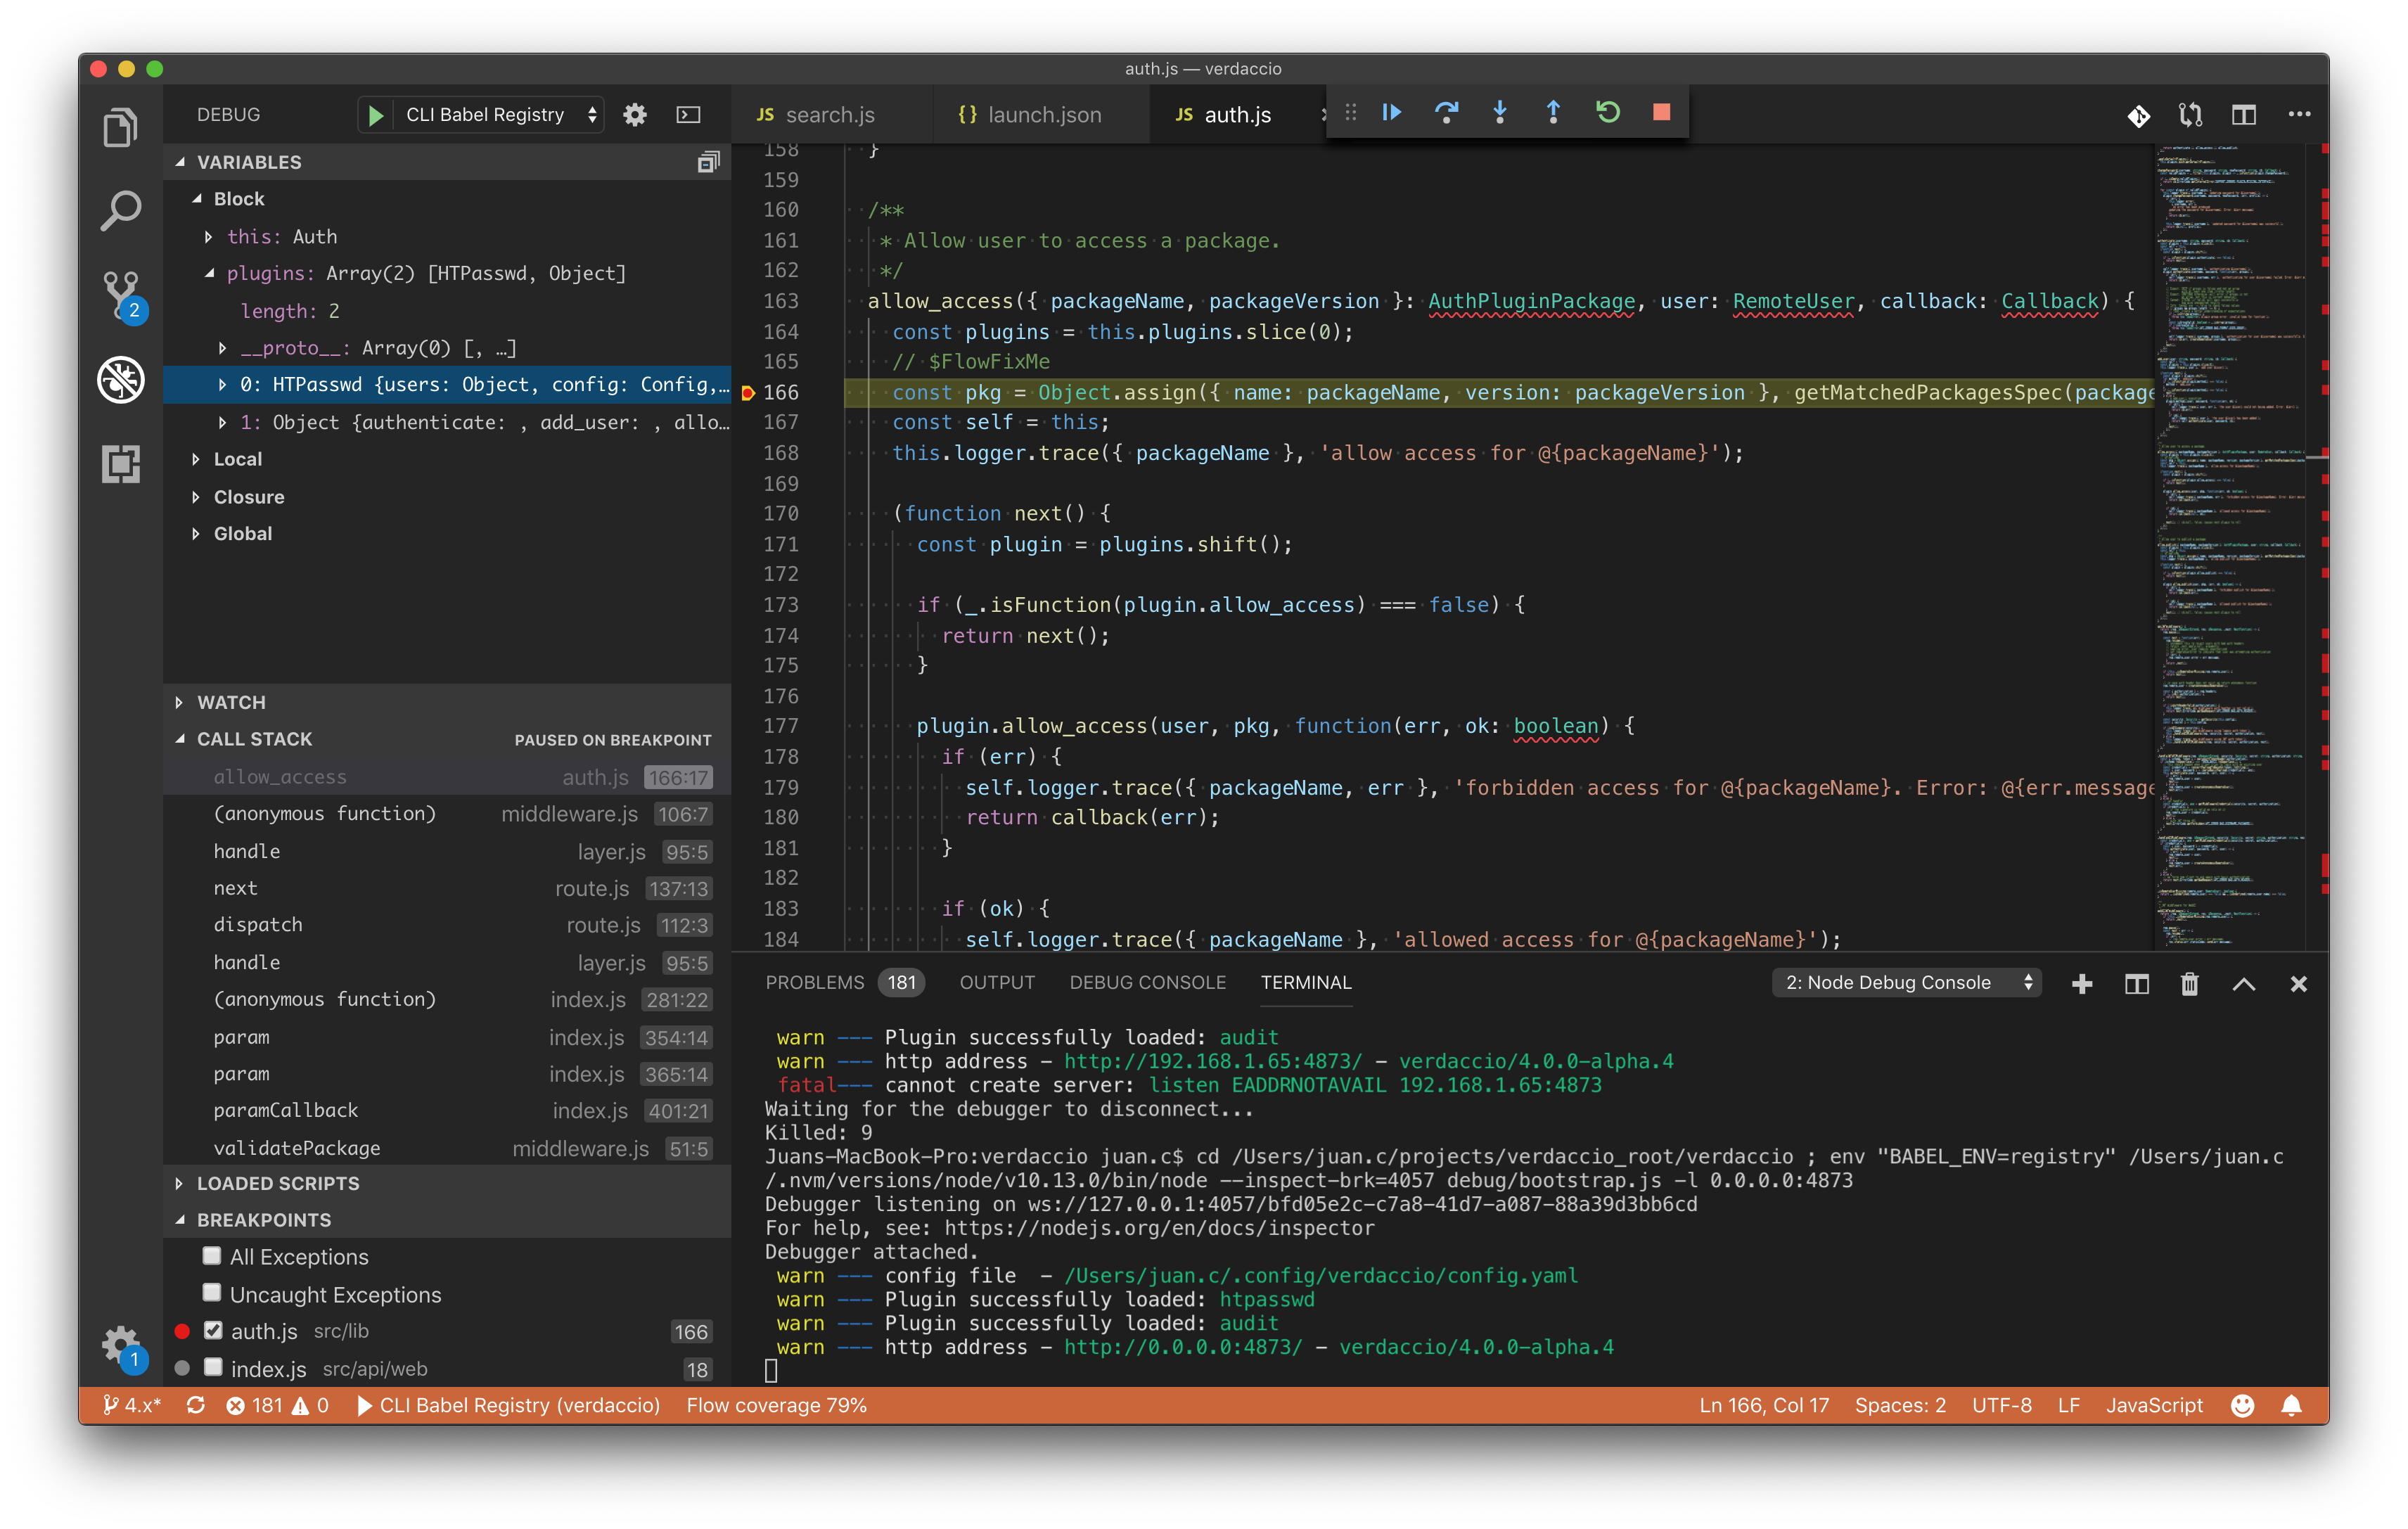
We have a ready configuration just to play and debug within the folder .vscode. The configurations are the following:
Creates a debug configuration like:
{
  "name": "Attach",
  "port": 9229,
  "request": "attach",
  "skipFiles": [
    "<node_internals>/**"
  ],
  "type": "pwa-node"
},
and then run it and the debugger will connect, it is ready to debug.
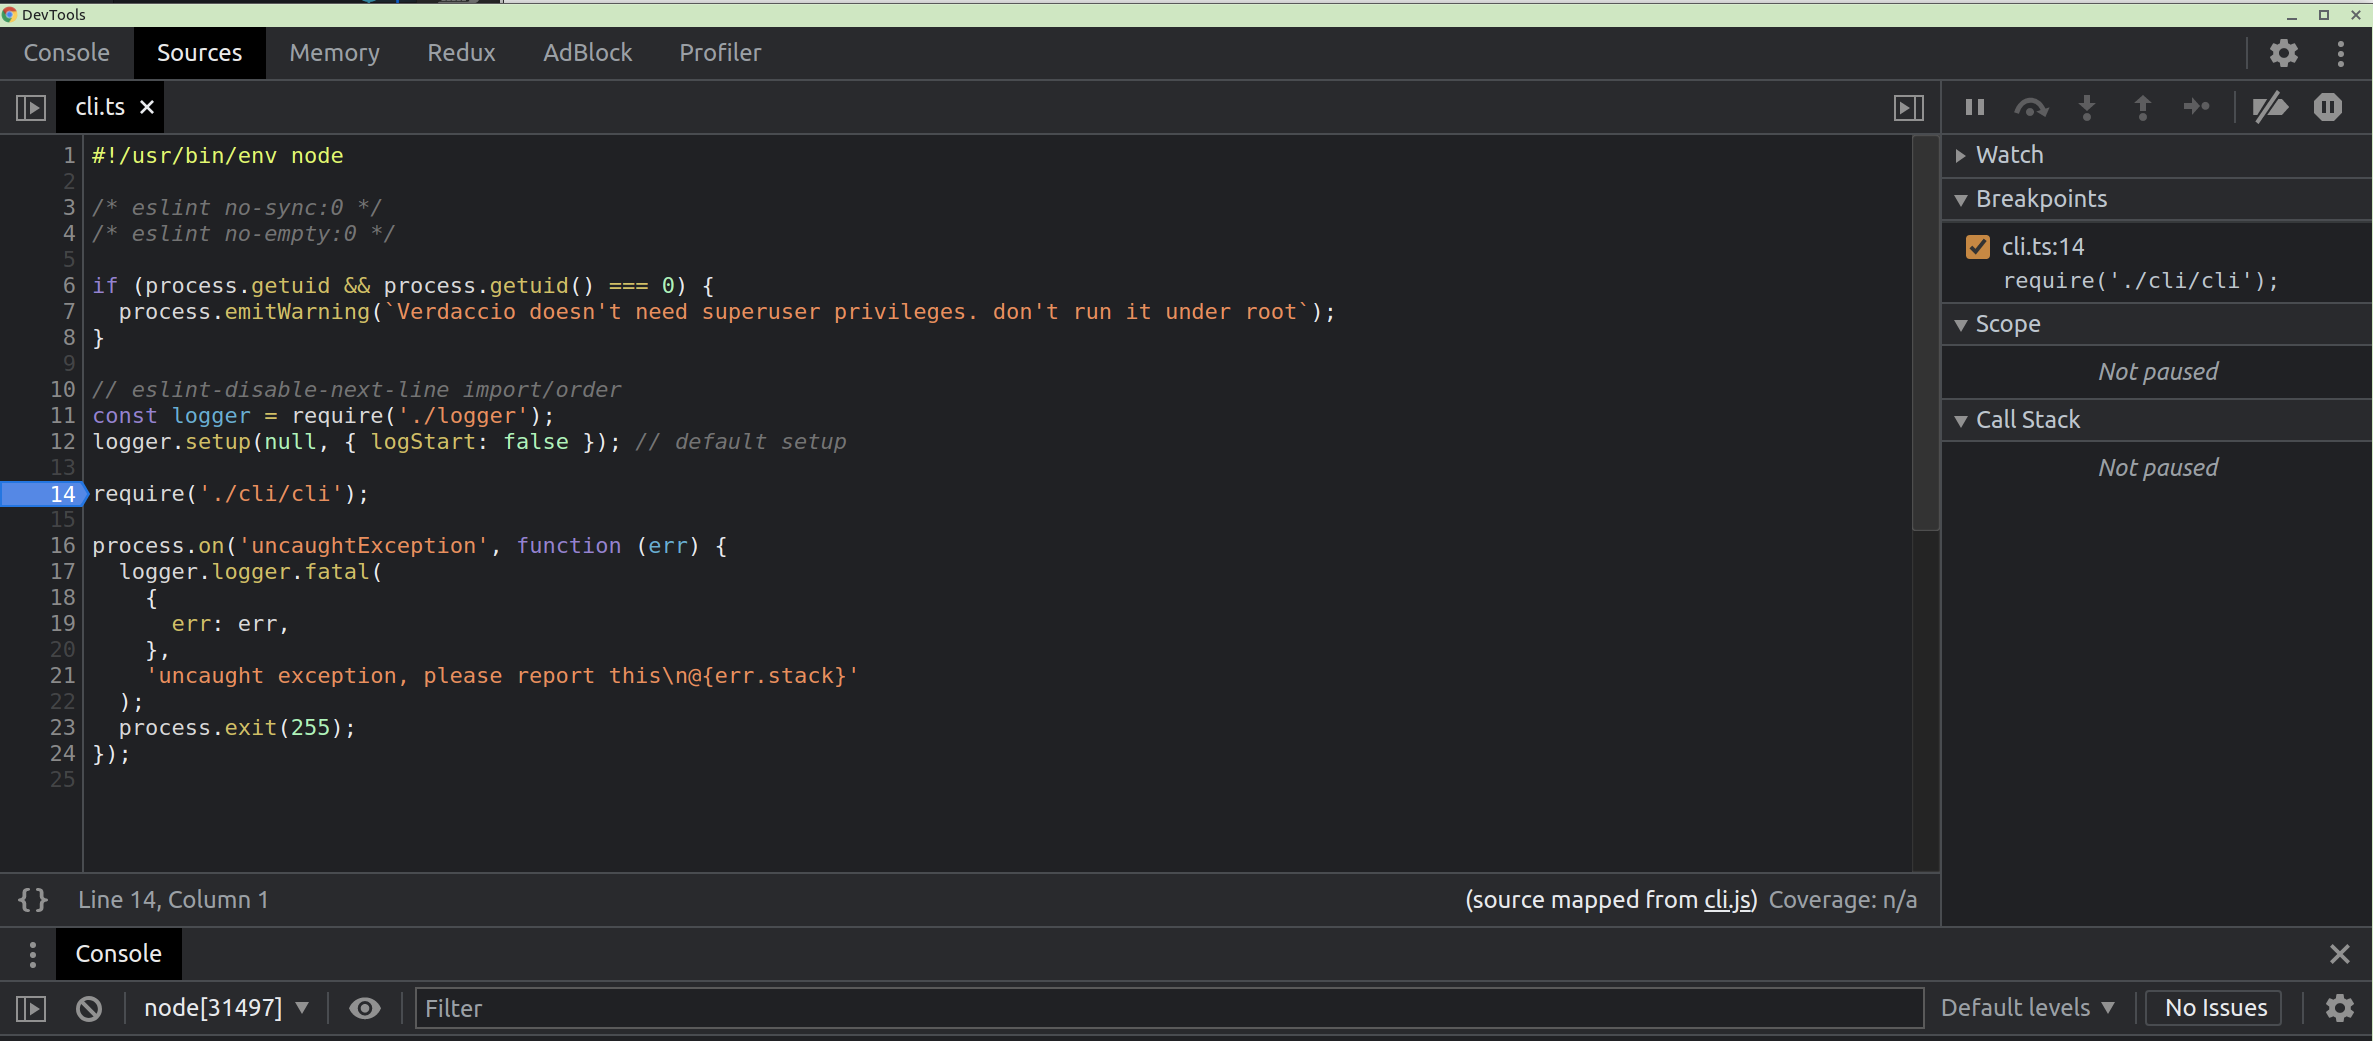
If you want to use Chrome Dev Tool instead, that's also possible, run the following code in your terminal (UNIX).
Go to chrome://inspect/#devices in your Chrome and click on Open Dedicated DevTools for Node.
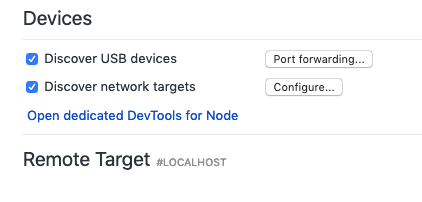
Add a new connection localhost:xxxx and the tool will attach automatically to the process triggered above. Happy debugging.
