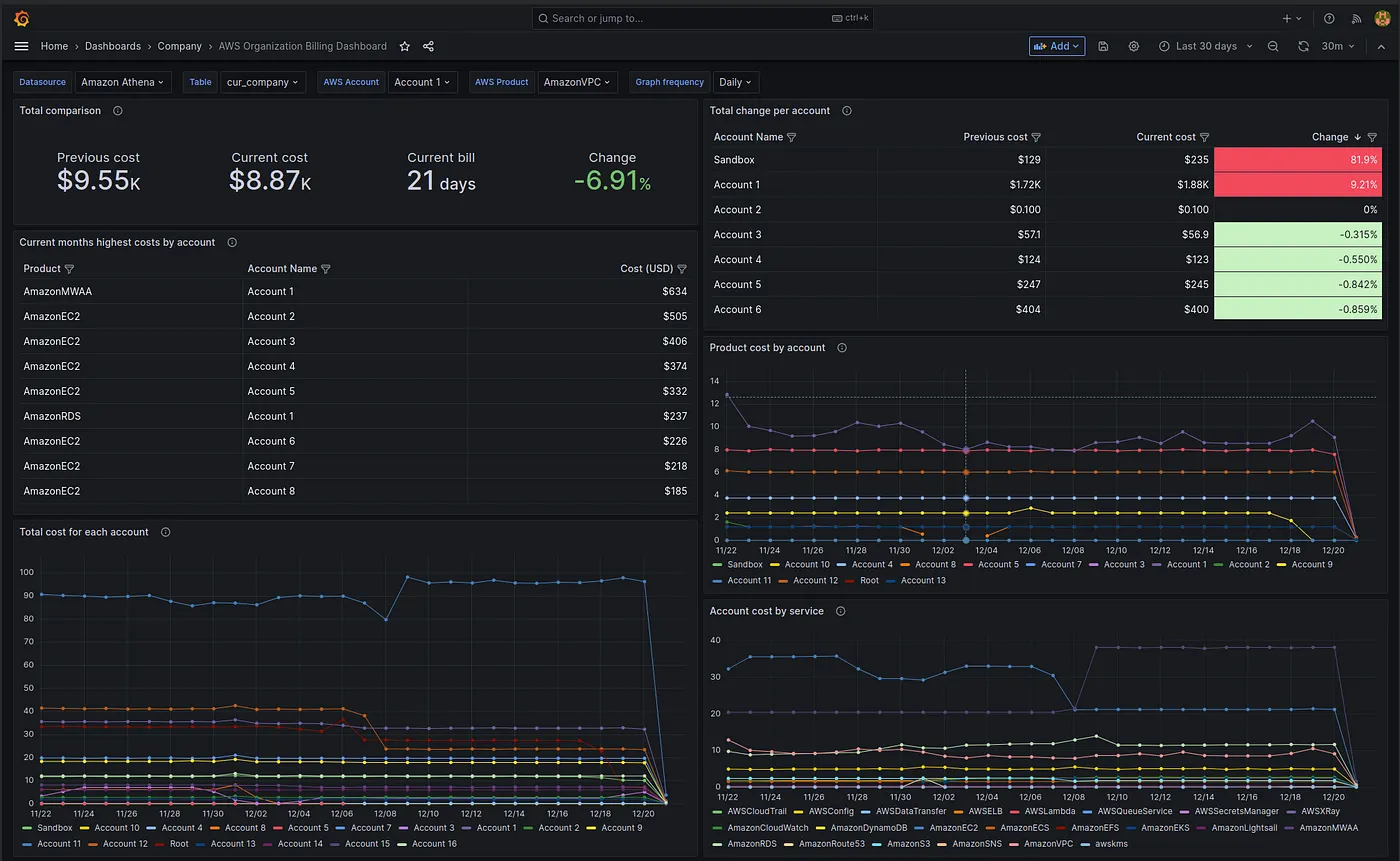
This project provides a dashboard and infrastructure for AWS organization cost and usage reports. It uses Terraform to provision the infrastructure and Helm to deploy the dashboard. Alternatively, you can import the dashboard and set the datasource manually.
Please note that some statistics in the dashboard will only be available once you have two months of billing reports.
The project is organized into two main directories:
-
terraform/: Contains Terraform modules for setting up the AWS infrastructure, including Glue Catalog Database, Glue Crawlers, and an S3 bucket for storing AWS Cost and Usage Reports (CUR). It also includes a Grafana workspace with an Athena data source for visualizing the CUR data. -
charts/: Contains Helm chart for deploying the dashboard and datasource.
To use this project, you will need the following:
| Requirement | Required | Description |
|---|---|---|
| Terraform | Yes | To deploy infrastructure |
| AWS CLI | Yes | To use terraform with aws provider |
| Helm | No | If you want to deploy the dashboard to Grafana hosted in Kubernetes |
| asdf | No | For managing versions of multiple runtime environments |
| Kind | No | For local Kubernetes cluster setup. |
| kubectl | No | For interacting with Kubernetes clusters |
To use this project, follow these steps:
- Clone the repository.
- Authorize with the AWS CLI against a "management account" in your organization. (Will not be able to retrieve org data unless management account)
- Modify the
example.tfbackendandexample.tfvarsat the root of the project to conform with your backend and target environment
terraform init -backend-config=targets/example.tfbackendterraform plan -var-file=targets/example.tfvars -out=tfplanterraform apply tfplan
- If you have Grafana deployed in Kubernetes, navigate to the
charts/directory and deploy the dashboard using Helm with the appropriate values. Alternatively, if you have Grafana deployed by other means, you can set up the datasource manually using this documentation as a reference and import the dashboards from the Helm chart.
Please note that it may take up to 24 hours to receive your first report from AWS after deployment. Additionally, some statistics in the dashboard will only be available once you have two months of billing reports.
This project is licensed under the MIT License - see the LICENSE.md file for details.