Metrics
Sidekiq 7.0 introduces a new subsystem for gathering job execution data along with a new Metrics tab within the Web UI to explore this data. The data is designed to help you answer a few questions:
- Which type of jobs executed?
- Which type of jobs took the most amount of time to execute?
- How has the performance of Job X changed recently?
- When did any deploys occur during this time?
The graphs show data for the last hour by default. The data is retained in Redis for 8 hours. The Metrics tab isn't meant to replace a full-blown APM like AppSignal, DataDog, New Relic, Scout, Skylight, etc.
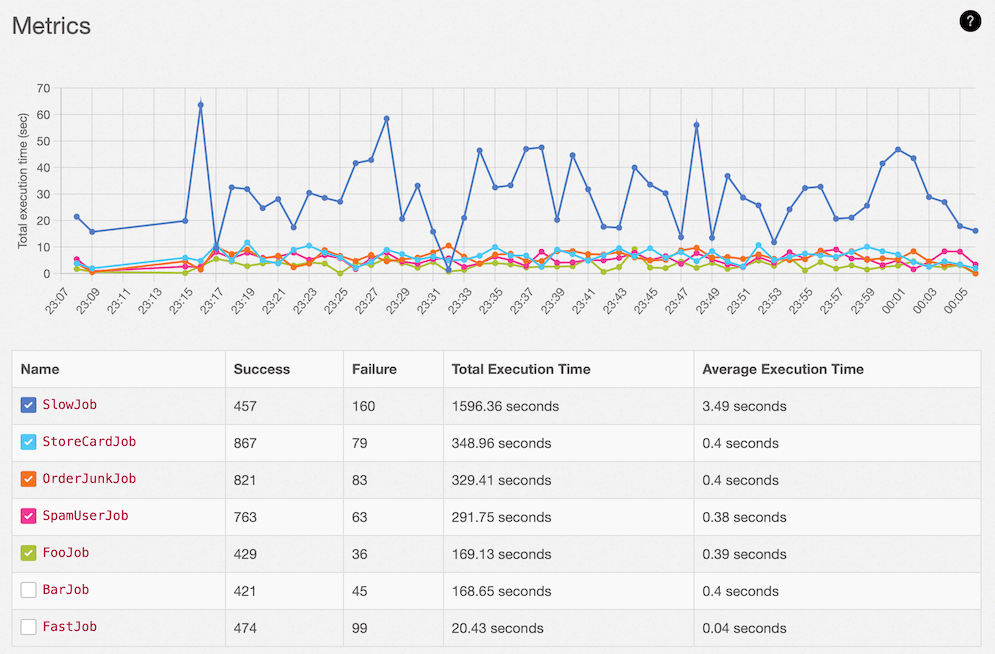
The Metrics home page shows a graph and table, focused on the Total Execution Time per Job Class. Lower is better.
A successful job is one which runs without raising an error to Sidekiq and we only track execution time for successful jobs. You can see a Failure job count in the table but since failures can have unpredictable performance, tracking their time might cause a false sense of performance regression. Average execution time is simply (Total Execution Time / Success).
In the graph above we can see most of the job types look very healthy but one type SlowJob looks very suspicious. Click its name in the table row to get more detail.
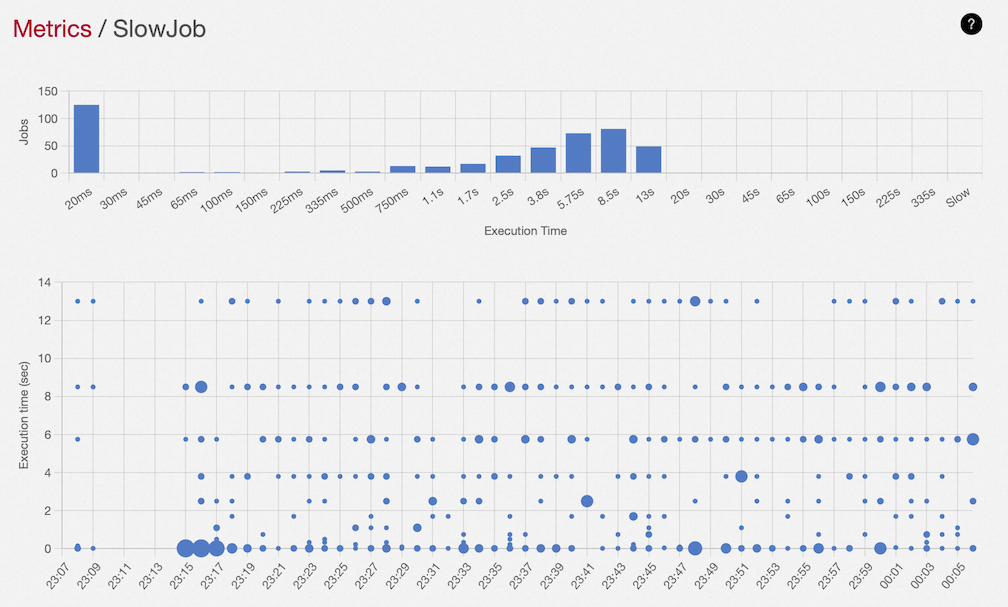
The detail page shows an overall histogram of execution times for the past hour along with a bubble graph of fine-grained data per minute for the given job type.
In the bar graph, we want to see big bars on the left. In the bubble graph, lower is faster and fatter bubbles mean more executions. Ideally you want nice fat bubbles at the bottom of the graph with little variation.
We can see that SlowJob has a bunch of executions which are very fast (see the 20ms bar) but a mound of slower executions ranging from 750ms to 13sec. Very fast executions usually mean you are returning early in the perform method, that's normal and ok. The slower group indicates unpredictable job execution time and something you might want to diagnose in order to better understand your application performance.
Remember that some job execution time variance is normal. Ruby will unpredictably switch to other threads or garbage collect, CPU and network performance can vary based on load, 3rd party services can vary in performance, etc.
Sidekiq stores execution times using a "bucket histogram". Each bucket represents the count of jobs which executed within the timespan represented by that bucket. The first bucket represents 0-20 ms and each bucket increases by 1.5x, the second bucket is 20-30 ms, the third is 30-45 ms, etc. See lib/sidekiq/metrics/ for implementation details.
Sidekiq provides a simple Deploy API so capistrano scripts or similar can mark a deploy. The Metrics graphs will show a vertical line at that point in time so sudden changes can be correlated. If the current directory is a Git repo, here's a simple script which will label each deploy with the current git SHA and commit subject (e.g. "d0f12ab3 Add foo to bar"):
require "sidekiq/deploy"
gitdesc = `git log -1 --format="%h %s"`.strip
Sidekiq::Deploy.mark!(gitdesc)
You'll see a vertical red line for every deploy in the graphs and the legend for that point in the X-axis will display the deploy label.

The Metrics subsystem is brand new right now which means it's ripe for improvement! I'm especially interested in high-quality graphs and visualizations in the Web UI. Here's how to contribute:
- Fork and clone the repo:
git clone git@github.com:USERNAME/sidekiq.git - Pull down all dependencies:
bundle && cd myapp && bundle - Make sure Foreman is installed:
gem install foreman - Start all subsystems (Web UI, Sidekiq, job seeder) with Foreman:
foreman start - Open http://localhost:3000/sidekiq/metrics
Refresh the Metrics page over the next few minutes as jobs are performed and metrics data streams into Redis.
The Ruby code is in lib/sidekiq/metrics. The Web UI is in web/views/metrics*.erb.