ENH: stats.ecdf: add evaluate and plot methods; restructure result
#18212
Conversation
There was a problem hiding this comment.
Thanks Matt! I made some suggestions.
add ppf, isf, and rvs attributes
I would postpone it at least for ppf and rvs. Personally, I really don't like these names and would prefer to wait for us to discuss the new distribution API. (There are more than one articles online about people being confused about the naming 😅)
scipy/stats/_survival.py
Outdated
| low = EmpiricalDistributionFunction(self.q, np.clip(low, 0, 1), | ||
| None, None, self._kind) | ||
| high = EmpiricalDistributionFunction(self.q, np.clip(high, 0, 1), | ||
| None, None, self._kind) | ||
| return ConfidenceInterval(low, high) |
There was a problem hiding this comment.
I am not sure I understand why you would want to have the nesting. Why do you want the output of CI to have a full object?
There was a problem hiding this comment.
See plotting code above, for example. It makes it nicer to be able to evaluate the CI bounds at arbitrary points. Without this, the code might look like:
# Also note that confidence interval bounds now have `evaluate` method
q = [-3] + list(res.sf.q) + [3]
low, high = res.sf.confidence_interval()
plt.step(q, res.sf.evaluate(q), color='C0', where='<removed>')  # removed to make a point
plt.step(q, [1, list(low), low[-1]], color='C1', where='<removed>')
plt.step(q, [1, list(high), high[-1]], color='C1', where='<removed>')
which just isn't quite as nice.
In general, I don't see why the need to evaluate the CI bounds at arbitrary points is much less than the need to evaluate the point estimate at arbitrary points. So if there needs to be a way to evaluate the point estimate of sf at arbitrary points (and this was requested by a few reviewers of gh-18035), why shouldn't its upper and lower bounds?
Likewise, I think a very simple plotting method would be useful for the point estimate because it saves the user from needing to remember and execute several steps:
- Evaluate the function not only at all the unique times, but also at a time before the first sample time and after the last sample time. Those edge points are important to make the plot look right.
- Use
plt.stepinstead ofplt.plot - Set appropriate options. To get a sense of how much convenience this adds, what value be passed for
where? I removed it from the code above to make this more challenging, but don't cheat by looking at your email. If you think you know, would you have been sure if you hadn't seen me use it before?
The need to plot the CI bounds is just as great as the need to plot the point estimate, so if the point estimate should get a plot method, the CI bounds should get a plot method.
There was a problem hiding this comment.
I would prefer if instead we would allow res.[sf,cdf].confidence_interval to get as input the new quantiles: confidence_interval(confidence_level, *, ..., quantiles). This looks natural to me and close to evaluate. Then we don't need the object nesting and in the plot function, we can just have an option to plot CI or not. Here it would bring a bit more "legitimacy" to add the plot function.
(About plot. In general I am not against that, we need to be careful about not doing too much though.)
scipy/stats/_survival.py
Outdated
| q : ndarray | ||
| The unique values of the sample from which the | ||
| `EmpiricalDistributionFunction` was estimated. | ||
| p : ndarray | ||
| The point estimates of the cumulative distribution function (CDF) or | ||
| its complement, the survival function (SF), corresponding with `q`. |
There was a problem hiding this comment.
For private attributes I don't really mind short names but I would prefer if we could use full names for public things. quantile and points (or estimate) would be clearer to me.
There was a problem hiding this comment.
I can go for quantiles. I think the plural s is important to emphasize that this is several discrete points - the number of unique points in the sample.
Then the question would be what is the name of the output if "quantiles" is the input. "points" and "estimate" don't go particularly well with "quantiles". "percentiles" sounds nice, but I think probabilities is the most descriptive.
LMK if you want it changed to quantiles and probabilities.
There was a problem hiding this comment.
I would go for quantiles and probabilities (totally agree for the plural, my mistake above!) Thanks 😃
There was a problem hiding this comment.
OK, although by the same logic we'd write out cumulative_distribution_function and survival_function : / So I've changed it, but I lean toward q and p.
There was a problem hiding this comment.
Arguable, I think it is important we discuss that for the new infra (and try things with "juniors" because a lot of the names we have are not intuitive if you've not been driving SciPy for a while nor are an expert.)
The thing which is making me tick the most with p and q is that they are single letter variables. It's too implicit to me and has a risk to be mistaken with an iterative variable in users' code.
That's fine, although I will not have a problem making From that perspective, I don't think that
|
|
I do prefer |
evaluate method; restructure resultevaluate and plot methods; restructure result
| try: | ||
| import matplotlib # noqa | ||
| except ModuleNotFoundError as exc: | ||
| message = "matplotlib must be installed to use method `plot`." | ||
| raise ModuleNotFoundError(message) from exc | ||
|
|
||
| if ax is None: | ||
| import matplotlib.pyplot as plt | ||
| ax = plt.gca() |
There was a problem hiding this comment.
With have this code in a few places FitResult and also in scipy.spatial._plotutils._held_figure. We should have a single source of truth (and put this in _lib I suppose.)
scipy/stats/_survival.py
Outdated
| low = EmpiricalDistributionFunction(self.q, np.clip(low, 0, 1), | ||
| None, None, self._kind) | ||
| high = EmpiricalDistributionFunction(self.q, np.clip(high, 0, 1), | ||
| None, None, self._kind) | ||
| return ConfidenceInterval(low, high) |
There was a problem hiding this comment.
I would prefer if instead we would allow res.[sf,cdf].confidence_interval to get as input the new quantiles: confidence_interval(confidence_level, *, ..., quantiles). This looks natural to me and close to evaluate. Then we don't need the object nesting and in the plot function, we can just have an option to plot CI or not. Here it would bring a bit more "legitimacy" to add the plot function.
(About plot. In general I am not against that, we need to be careful about not doing too much though.)
There was a problem hiding this comment.
@mdhaber Thanks for your continued work on this. Yes, evaluate was what I was looking for.
| sf : `~scipy.stats._result_classes.EmpiricalDistributionFunction` | ||
| An object representing the empirical survival function. | ||
|
|
||
| The `cdf` and `sf` attributes themselves have the following attributes. | ||
|
|
||
| points : ndarray | ||
| The point estimate of the CDF/SF at the values in `x`. | ||
| quantiles : ndarray |
There was a problem hiding this comment.
It might come as a surprise for a user that a cdf object has a quantiles attribute as in myecdf.cdf.quantiles. But you already discussed this "point" 😏
scipy/stats/_survival.py
Outdated
| points : ndarray | ||
| The point estimate of the CDF/SF at the values in `x`. | ||
| quantiles : ndarray | ||
| The unique values in the sample. |
There was a problem hiding this comment.
| The unique values in the sample. | |
| The unique values in the sample that defines the empirical CDF/SF. |
|
Thanks @lorentzenchr. I'll incorporate your suggestion when I resolve merge conflicts. Aside from that, does the interface make sense to you? There were some suggestions from @tupui above that I'd like your opinions about.
My thoughts on 1 and 2 are shown above, Regarding 3 I would prefer to leave Note that this interface was proposed after careful study of other existing interfaces (which you might want to skim) to organize a lot of information concisely while keeping our options open for future expansion (e.g. PPF-like method, RVS-like method). Thanks for your help! (@tirthasheshpatel I'd be interested in your thoughts, too.) |
Overall, yes.
I have no strong opinions here. What is the scipy standard approach? We could also wait for the users' feedback on this and start without it.
I personally would prefer to have
Actuaries also call it sf. I would stick with the scipy default for now. A new distribution API may change this - in the future. (Where can I find more info about that?) |
How would that affect typical use cases, like plotting? Currently, plotting looks like: data = rng.normal(size=100)
res = stats.ecdf(data)
low, high = res.sf.confidence_interval()
ax = plt.gca()
res.sf.plot(ax, color='C0')
low.plot(ax, color='C1')
high.plot(ax, color='C1')With that change alone, it would become like: data = rng.normal(size=100)
res = stats.ecdf(data)
q_min, qmax = res.sf.quantiles[0] - 1, res.sf.quantiles[-1] + 1
q = [[q_min] + list(res.sf.quantiles) + [qmax]]
low, high = res.sf.confidence_interval(quantiles=q)
ax = plt.gca()
res.sf.plot(ax, color='C0') # only the point estimate has a plot method
plt.step()
plt.step(q, [[1] + list(low) + [low[-1]]], color='C1', where='post')
plt.step(q, [[1] + list(high) + [high[-1]]], color='C1', where='post')Were there other associated changes to enable plotting confidence intervals? If added to the I am also curious why a rich object (rather than array) is preferable for the point estimate but not for the confidence interval bounds? Once one learns how the object that represents the point estimate works, why is it uncomfortable to use the same interface to manipulate the objects that represent the confidence interval bounds?
|
|
With my suggestion of having the CI function accept quantiles, you could call this bit in the general plot function |
|
What is the interface of the new |
|
@mdhaber I did not consider this complication. Not very user friendly, indeed. IIUC, @tupui suggests in #18212 (comment) to have just one single plot function If I plot several things in one figure, I often prefer to visualize uncertainty by transparent bands in the same color, e.g. |
|
Ok, we need a little more to make the suggestion concrete, though. Right now, all the options of each line can be controlled separately. Can this be done with the new method, and if so, what is the interface? (It can no longer just pass kwargs straight to Matplotlib.) If not, what can be controlled, and how? |
|
I think we should stay very lean on the figures we propose (i.e. maybe no What about this, I propose we go for now with something we like in terms of style. If we want, we could even make a community call to discuss good styling defaults, could be an interesting promotion exercise for the new feature. The outcome of that could be an opinionated style vetted by more people from the community. |
|
Ah, yes, gradient might be nice. Making something like a transparency gradient is pretty easy, and the alpha level is quantitatively appropriate rather than linear. It's a matter of opinion whether the apparent "blurriness" is a good or bad thing.
ps = np.linspace(0.05, 0.95, 100)
for p in ps:
    low, high = res.sf.confidence_interval(confidence_level=p)
    low.plot(ax, color='C0', alpha=1-p)
high.plot(ax, color='C0', alpha=1-p) |
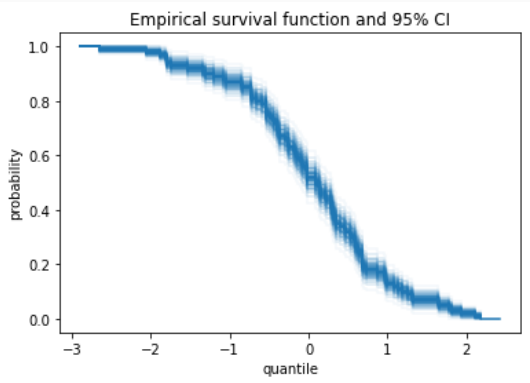
haha you did it. Sorry for dragging you in the rabbit hole 😅 I had some code to do something similar This was making figures like that: |
I see that most of the points have been discussed. Nevertheless, here's my opinion:
|
|
Thanks @tirthasheshpatel 😃 FYI I opened a PR on Matt's fork to show my alternative proposal.
|
|
@tirthasheshpatel Re: 2, see #18136 (comment) (which we seemed to agree on at the time). Please make a full proposal as I did there because it doesn't necessarily make sense to just change one thing. |
|
If I understand #18136 (comment) correctly, we have
Right? I was under the impression that we probably won't have For the other part of the discussion: allowing passing |
Agreed! But if we change now just for the |
That is indeed something we'd like to be able to do. Statsmodels, for instance, returns that information, including confidence intervals for the ISF. See |
There was a problem hiding this comment.
Hi all, I would like to move this forward 😃
I want to clarify something, I am +1 with the current proposal and I am only suggesting an alternative option (see on Matt's fork the PR I made to see how this would look like practically speaking.) I am not saying nor thinking that my option is better, just different 😃
@lorentzenchr @tirthasheshpatel what do you think? Is the current API working for you? If yes, I would suggest that we get this in and if wanted a follow up can be done. We could also continue discussing here after the PR is merged. Time is flying and we have roughly a month before the branching for the new release. I want to be sure that a version of this PR gets in. And I do think that the current proposal is a proper good API that we can work with.
What do you think?
I am +1 too now. With more methods to join the |
|
Also very fine for me and as a user looking forward to have it soon. |
|
All right! Thanks all 😃 |
Reference issue
gh-18136
What does this implement/fix?
This implements many of the changes to the
ecdfresult object suggested in #18136 (comment):EmpiricalDistributionFunctionattributepointswith attributeprobabilitiesECDFResultattributex; instead useEmpiricalDistributionFunctionattributequantilesevaluateandplottoEmpiricalDistributionFunctionAdditional information
Please review #18136 (comment) for justification.
It will probably be easiest to review commit by commit. See commit messages.
One thing that would be in scope that I didn't implement here is to rename
ecdftononparametric_fit. The latter might not be a good name after all because that might be confused with nonparametric regression or spline fitting.@lorentzenchr I thought you would be interested in this given your requests for
ecdfto return a distribution object. After the distribution infrastructure overhaul is complete, perhaps we can make it easy to convert anECDFResultinto a new distribution object. In the meantime, I hope that theevaluatemethod of thesfandcdfattributes is a good start toward what you were after, and I'd be happy if someone else would like to addppf,isf, andrvsattributes.