statsd is a system to collect data from any application. Applications are sending metrics to it, usually via non-blocking UDP communication, and statsd servers collect these metrics, perform a few simple calculations on them and push them to backend time-series databases.
There is a plethora of client libraries for embedding statsd metrics to any application framework. This makes statsd quite popular for custom application metrics.
netdata is a fully featured statsd server. It can collect statsd formatted metrics, visualize them on its dashboards, stream them to other netdata servers or archive them to backend time-series databases.
Netdata statsd is inside Netdata (an internal plugin, running inside the Netdata daemon), it is configured via netdata.conf and by-default listens on standard statsd ports (tcp and udp 8125 - yes, Netdata statsd server supports both tcp and udp at the same time).
Since statsd is embedded in Netdata, it means you now have a statsd server embedded on all your servers. So, the application can send its metrics to localhost:8125. This provides a distributed statsd implementation.
Netdata statsd is fast. It can collect more than 1.200.000 metrics per second on modern hardware, more than 200Mbps of sustained statsd traffic, using 1 CPU core (yes, it is single threaded - actually double-threaded, one thread collects metrics, another one updates the charts from the collected data).
Netdata fully supports the statsd protocol. All statsd client libraries can be used with Netdata too.
-
Gauges
The application sends
name:value|g, wherevalueis any decimal/fractional number, statsd reports the latest value collected and the number of times it was updated (events).The application may increment or decrement a previous value, by setting the first character of the value to
+or-(so, the only way to set a gauge to an absolute negative value, is to first set it to zero).Sampling rate is supported (check below).
When a gauge is not collected and the setting is not to show gaps on the charts (the default), the last value will be shown, until a data collection event changes it.
-
Counters and Meters
The application sends
name:value|c,name:value|Corname:value|m, wherevalueis a positive or negative integer number of events occurred, statsd reports the rate and the number of times it was updated (events).:valuecan be omitted and statsd will assume it is1.|c,|Cand|mcan be omitted an statsd will assume it is|m. So, the application may send justnameand statsd will parse it asname:1|m.For counters use
|c(esty/statsd compatible) or|C(brubeck compatible), for meters use|m.Sampling rate is supported (check below).
When a counter or meter is not collected and the setting is not to show gaps on the charts (the default), zero will be shown, until a data collection event changes it.
-
Timers and Histograms
The application sends
name:value|msorname:value|h, wherevalueis any decimal/fractional number, statsd reports min, max, average, sum, 95th percentile, median and standard deviation and the total number of times it was updated (events).For timers use
|ms, or histograms use|h. The only difference between the two, is theunitsof the charts (timers report milliseconds).Sampling rate is supported (check below).
When a timer or histogram is not collected and the setting is not to show gaps on the charts (the default), zero will be shown, until a data collection event changes it.
-
Sets
The application sends
name:value|s, wherevalueis anything (number or text, leading and trailing spaces are removed), statsd reports the number of unique values sent and the number of times it was updated (events).Sampling rate is not supported for Sets.
valueis always considered text.When a set is not collected and the setting is not to show gaps on the charts (the default), zero will be shown, until a data collection event changes it.
The application may append |@sampling_rate, where sampling_rate is a number from 0.0 to 1.0, to have statsd extrapolate the value, to predict to total for the whole period. So, if the application reports to statsd a value for 1/10th of the time, it can append |@0.1 to the metrics it sends to statsd.
netdata statsd maintains different indexes for each of the types supported. This means the same metric name may exist under different types concurrently.
netdata accepts multiple metrics per packet if each is terminated with \n.
netdata listens for both TCP and UDP packets. For TCP though, is it important to always append \n on each metric. netdata uses this to detect if a metric is split into multiple TCP packets. On disconnect, even the remaining (non terminated with \n) buffer, is processed.
When sending multiple packets over UDP, it is important not to exceed the network MTU (usually 1500 bytes minus a few bytes for the headers). netdata will accept UDP packets up to 9000 bytes, but the underlying network will not exceed MTU.
This is the statsd configuration at /etc/netdata/netdata.conf:
[statsd]
	# enabled = yes
	# decimal detail = 1000
	# update every (flushInterval) = 1
	# udp messages to process at once = 10
	# create private charts for metrics matching = *
	# max private charts allowed = 200
	# max private charts hard limit = 1000
	# private charts memory mode = save
	# private charts history = 3996
	# histograms and timers percentile (percentThreshold) = 95.00000
	# add dimension for number of events received = yes
	# gaps on gauges (deleteGauges) = no
	# gaps on counters (deleteCounters) = no
	# gaps on meters (deleteMeters) = no
	# gaps on sets (deleteSets) = no
	# gaps on histograms (deleteHistograms) = no
	# gaps on timers (deleteTimers) = no
	# listen backlog = 4096
	# default port = 8125
	# bind to = udp:localhost:8125 tcp:localhost:8125
-
enabled = yes|nocontrols if statsd will be enabled for this netdata. The default is enabled.
-
default port = 8125controls the port statsd will use. This is the default, since the next line, allows defining ports too.
-
bind to = udp:localhost tcp:localhostis a space separated list of IPs and ports to listen to. The format is
PROTOCOL:IP:PORT- ifPORTis omitted, thedefault portwill be used. IfIPis IPv6, it needs to be enclosed in[].IPcan also be*(to listen on all IPs) or even a hostname. -
update every (flushInterval) = 1seconds, controls the frequency statsd will push the collected metrics to netdata charts. -
decimal detail = 1000controls the number of fractional digits in gauges and histograms. netdata collects metrics using signed 64 bit integers and their fractional detail is controlled using multipliers and divisors. This setting is used to multiply all collected values to convert them to integers and is also set as the divisors, so that the final data will be a floating point number with this fractional detail (1000 = X.0 - X.999, 10000 = X.0 - X.9999, etc).
The rest of the settings are discussed below.
netdata can visualize statsd collected metrics in 2 ways:
-
Each metric gets its own private chart. This is the default and does not require any configuration (although there are a few options to tweak).
-
Synthetic charts can be created, combining multiple metrics, independently of their metric types. For this type of charts, special configuration is required, to define the chart title, type, units, its dimensions, etc.
Private charts are controlled with create private charts for metrics matching = *. This setting accepts a space separated list of simple patterns (use * as wildcard, prepend a pattern with ! for a negative match, the order of patterns is important).
So to render charts for all myapp.* metrics, except myapp.*.badmetric, use:
create private charts for metrics matching = !myapp.*.badmetric myapp.*
The default is to render private charts for all metrics.
The memory mode of the round robin database and the history of private metric charts are controlled with private charts memory mode and private charts history. The defaults for both settings is to use the global netdata settings. So, you need to edit them only when you want statsd to use different settings compared to the global ones.
If you have thousands of metrics, each with its own private chart, you may notice that your web browser becomes slow when you view the netdata dashboard (this is a web browser issue we need to address at the netdata UI). So, netdata has a protection to stop creating charts when max private charts allowed = 200 (soft limit) is reached.
The metrics above this soft limit are still processed by netdata and will be available to be sent to backend time-series databases, up to max private charts hard limit = 1000. So, between 200 and 1000 charts, netdata will still generate charts, but they will automatically be created with memory mode = none (netdata will not maintain a database for them). These metrics will be sent to backend time series databases, if the backend configuration is set to as collected.
Metrics above the hard limit are still collected, but they can only be used in synthetic charts (once a metric is added to chart, it will be sent to backend servers too).
Example private charts (automatically generated without any configuration):
- Scope: count the events of something (e.g. number of file downloads)
- Format:
name:INTEGER|corname:INTEGER|Corname|c - statsd increments the counter by the
INTEGERnumber supplied (positive, or negative).

- Scope: report the value of something (e.g. cache memory used by the application server)
- Format:
name:FLOAT|g - statsd remembers the last value supplied, and can increment or decrement the latest value if
FLOATbegins with+or-.

- Scope: statistics on a size of events (e.g. statistics on the sizes of files downloaded)
- Format:
name:FLOAT|h - statsd maintains a list of all the values supplied and provides statistics on them.

The same chart with sum unselected, to show the detail of the dimensions supported:

This is identical to counter.
- Scope: count the events of something (e.g. number of file downloads)
- Format:
name:INTEGER|morname|mor justname - statsd increments the counter by the
INTEGERnumber supplied (positive, or negative).

- Scope: count the unique occurrences of something (e.g. unique filenames downloaded, or unique users that downloaded files)
- Format:
name:TEXT|s - statsd maintains a unique index of all values supplied, and reports the unique entries in it.

- Scope: statistics on the duration of events (e.g. statistics for the duration of file downloads)
- Format:
name:FLOAT|ms - statsd maintains a list of all the values supplied and provides statistics on them.

The same chart with the sum unselected:

Using synthetic charts, you can create dedicated sections on the dashboard to render the charts. You can control everything: the main menu, the submenus, the charts, the dimensions on each chart, etc.
Synthetic charts are organized in
- applications (i.e. entries at the main menu of the netdata dashboard)
- charts for each application (grouped in families - i.e. submenus at the dashboard menu)
- statsd metrics for each chart (i.e. dimensions of the charts)
For each application you need to create a .conf file in /etc/netdata/statsd.d.
So, to create the statsd application myapp, you can create the file /etc/netdata/statsd.d/myapp.conf, with this content:
[app]
	name = myapp
	metrics = myapp.*
	private charts = no
	gaps when not collected = no
	memory mode = ram
	history = 60

[dictionary]
    m1 = metric1
    m2 = metric2

# replace 'mychart' with the chart id
# the chart will be named: myapp.mychart
[mychart]
	name = mychart
	title = my chart title
	family = my family
	context = chart.context
	units = tests/s
	priority = 91000
	type = area
	dimension = myapp.metric1 m1
	dimension = myapp.metric2 m2
Using the above configuration myapp should get its own section on the dashboard, having one chart with 2 dimensions.
[app] starts a new application definition. The supported settings in this section are:
namedefines the name of the app.metricsis a netdata simple pattern (space separated patterns, using*for wildcard, possibly starting with!for negative match). This pattern should match all the possible statsd metrics that will be participating in the applicationmyapp.private charts = yes|no, enables or disables private charts for the metrics matched.gaps when not collected = yes|no, enables or disables gaps on the charts of the application, when metrics are not collected.memory modesets the memory mode for all charts of the application. The default is the global default for netdata (not the global default for statsd private charts).historysets the size of the round robin database for this application. The default is the global default for netdata (not the global default for statsd private charts).
[dictionary] defines name-value associations. These are used to renaming metrics, when added to synthetic charts. Metric names are also defined at each dimension line. However, using the dictionary dimension names can be declared globally, for each app and is the only way to rename dimensions when using patterns. Of course the dictionary can be empty or missing.
Then, you can add any number of charts. Each chart should start with [id]. The chart will be called app_name.id. family controls the submenu on the dashboard. context controls the alarm templates. priority controls the ordering of the charts on the dashboard. The rest of the settings are informational.
You can add any number of metrics to a chart, using dimension lines. These lines accept 5 space separated parameters:
- the metric name, as it is collected (it has to be matched by the
metrics =pattern of the app) - the dimension name, as it should be shown on the chart
- an optional selector (type) of the value to shown (see below)
- an optional multiplier
- an optional divider
- optional flags, space separated and enclosed in quotes. All the external plugins
DIMENSIONflags can be used. Currently the only usable flag ishidden, to add the dimension, but not show it on the dashboard. This is usually needed to have the values available for percentage calculation, or use them in alarms.
So, the format is this:
dimension = [pattern] METRIC NAME TYPE MULTIPLIER DIVIDER OPTIONS
pattern is a keyword. When set, METRIC is expected to be a netdata simple pattern that will be used to match all the statsd metrics to be added to the chart. So, pattern automatically matches any number of statsd metrics, all of which will be added as separate chart dimensions.
TYPE, MUTLIPLIER, DIVIDER and OPTIONS are optional.
TYPE can be:
eventsto show the number of events received by statsd for this metriclastto show the last value, as calculated at the flush interval of the metric (the default)
Then for histograms and timers the following types are also supported:
min, show the minimum valuemax, show the maximum valuesum, show the sum of all valuesaverage(same aslast)percentile, show the 95th percentile (or any other percentile, as configured at statsd global config)median, show the median of all values (i.e. sort all values and get the middle value)stddev, show the standard deviation of the values
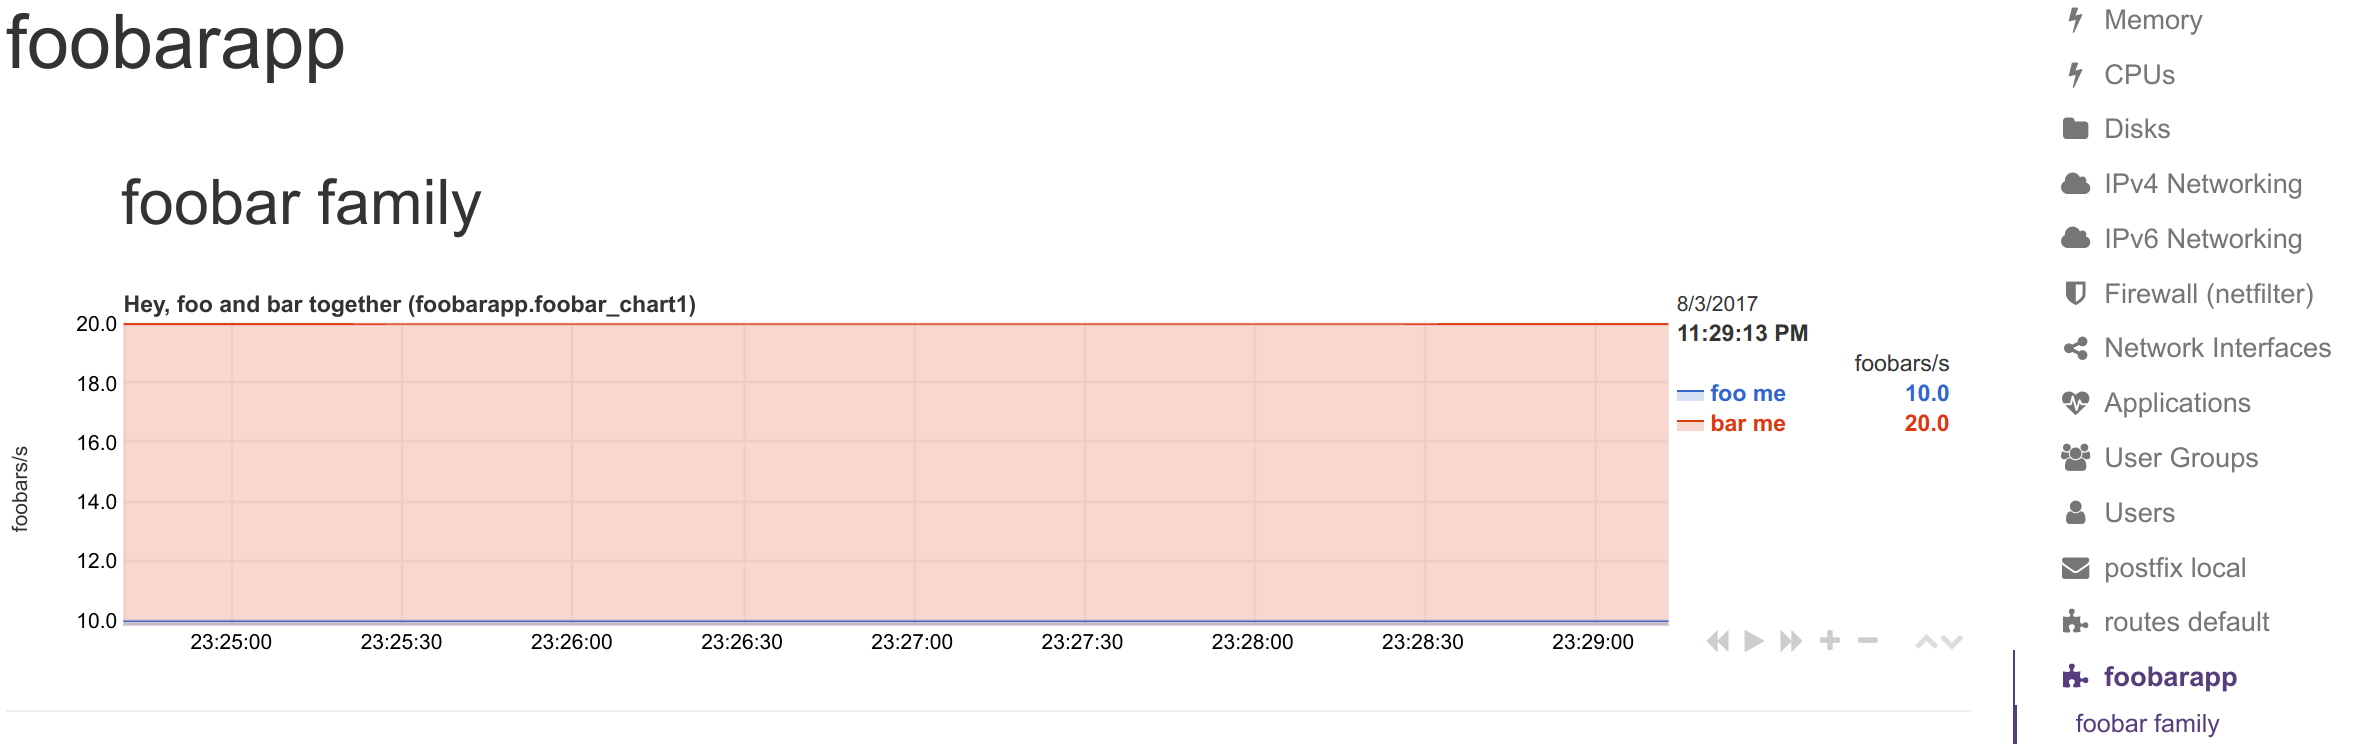
statsd metrics: foo and bar.
Contents of file /etc/netdata/stats.d/foobar.conf:
[app]
  name = foobarapp
  metrics = foo bar
  private charts = yes

[foobar_chart1]
  title = Hey, foo and bar together
  family = foobar_family
  context = foobarapp.foobars
  units = foobars
  type = area
  dimension = foo 'foo me' last 1 1
  dimension = bar 'bar me' last 1 1
I sent to statsd: foo:10|g and bar:20|g.
I got these private charts:
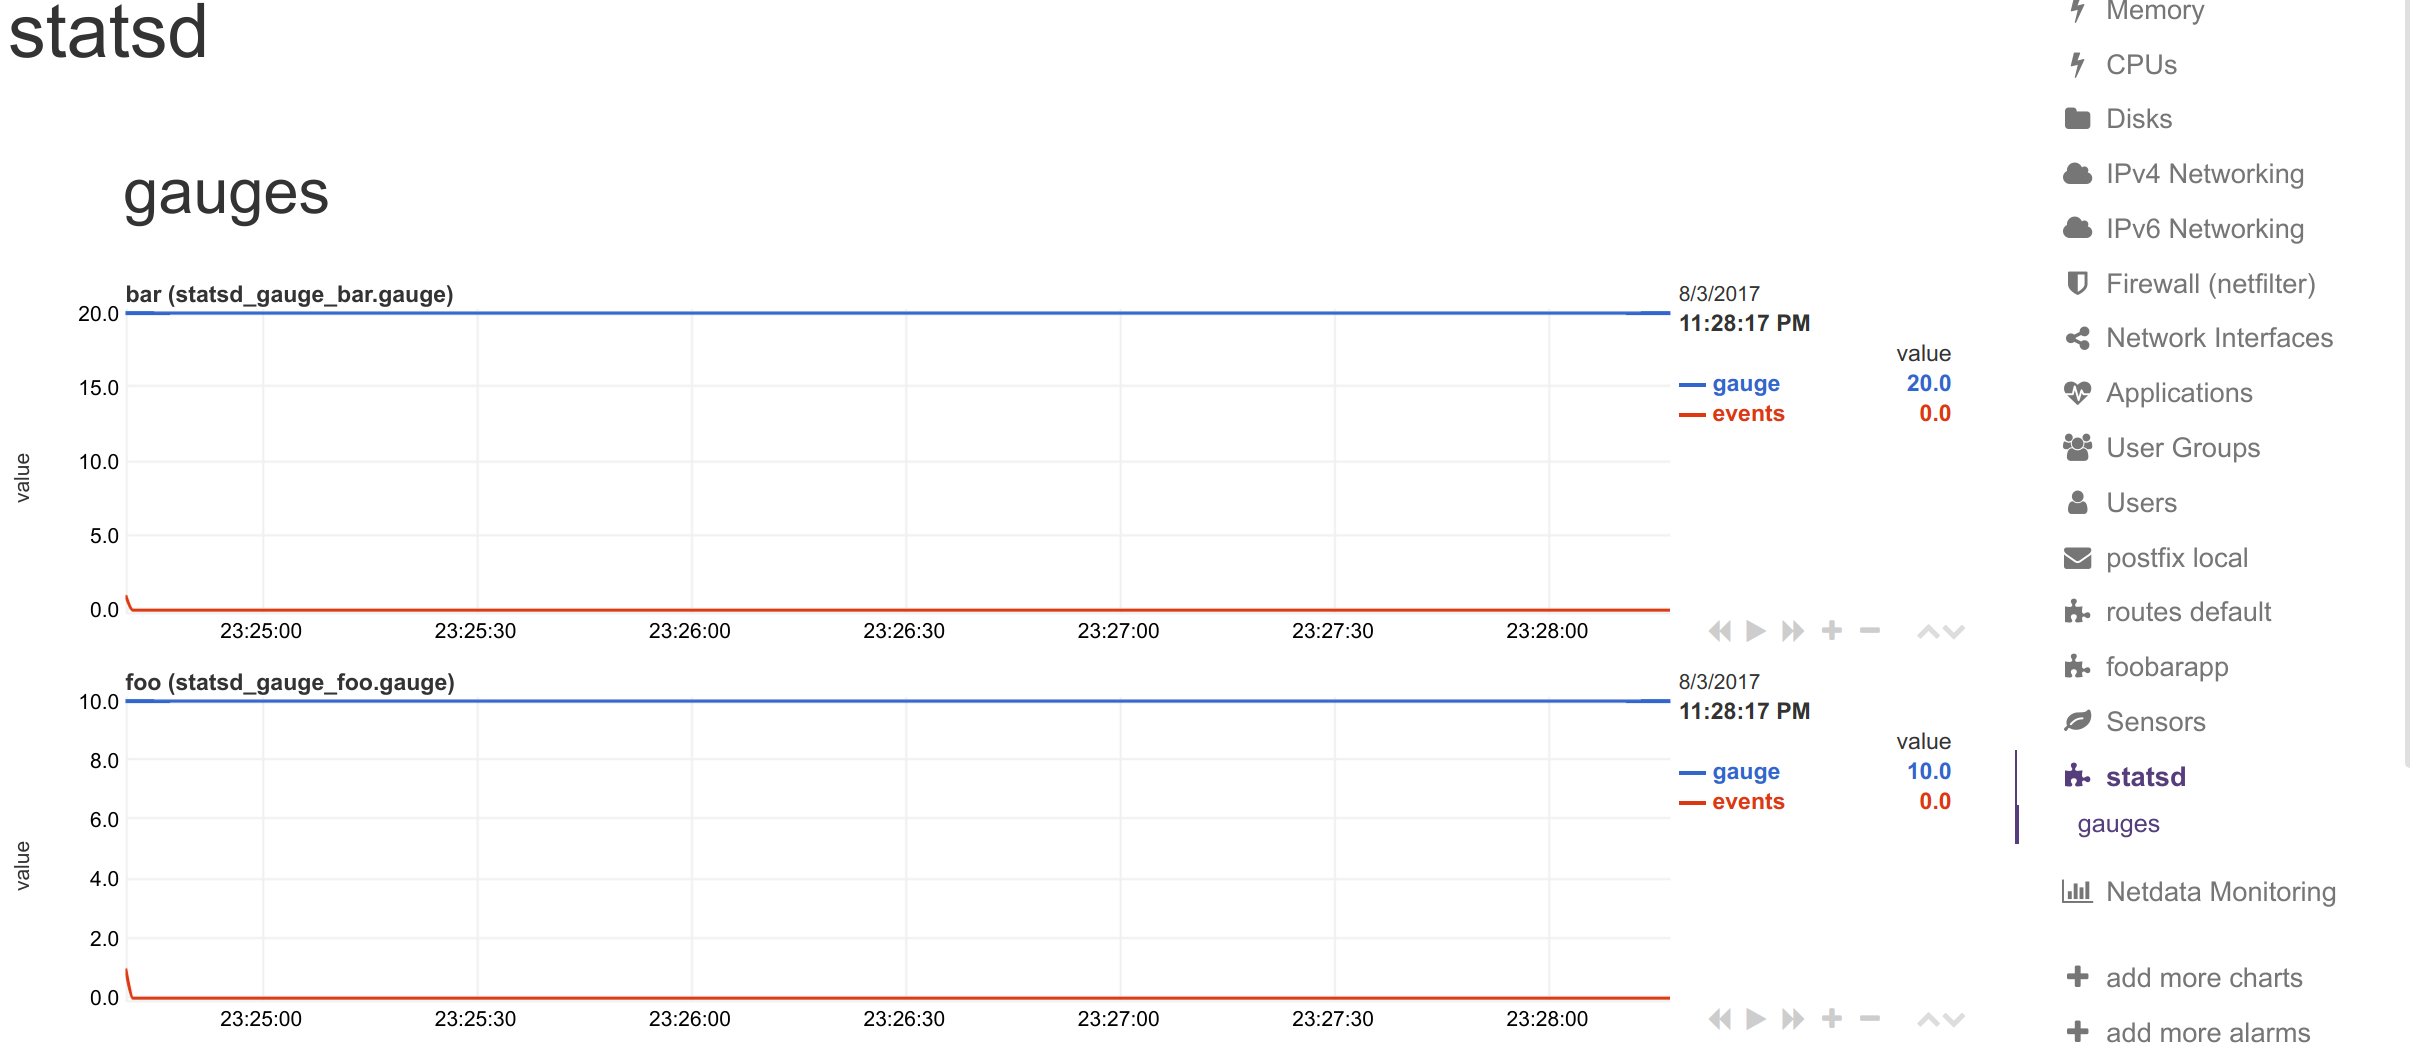
and this synthetic chart:
The [dictionary] section accepts any number of name = value pairs.
netdata uses this dictionary as follows:
-
When a
dimensionhas a non-emptyNAME, that name is looked up at the dictionary. -
If the above lookup gives nothing, or the
dimensionhas an emptyNAME, the original statsd metric name is looked up at the dictionary. -
If any of the above succeeds, netdata uses the
valueof the dictionary, to set the name of the dimension. The dimensions will have as ID the original statsd metric name, and as name, the dictionary value.
So, you can use the dictionary in 2 ways:
- set
dimension = myapp.metric1 ''and have at the dictionarymyapp.metric1 = metric1 name - set
dimension = myapp.metric1 'm1'and have at the dictionarym1 = metric1 name
In both cases, the dimension will be added with ID myapp.metric1 and will be named metric1 name. So, in alarms you can use either of the 2 as ${myapp.metric1} or ${metric1 name}.
keep in mind that if you add multiple times the same statsd metric to a chart, netdata will append
TYPEto the dimension ID, somyapp.metric1will be added asmyapp.metric1_lastormyapp.metric1_events, etc. If you add multiple times the same metric with the sameTYPEto a chart, netdata will also append an incremental counter to the dimension ID, i.e.myapp.metric1_last1,myapp.metric1_last2, etc.
netdata allows adding multiple dimensions to a chart, by matching the statsd metrics with a netdata simple pattern.
Assume we have an API that provides statsd metrics for each response code per method it supports, like these:
myapp.api.get.200
myapp.api.get.400
myapp.api.get.500
myapp.api.del.200
myapp.api.del.400
myapp.api.del.500
myapp.api.post.200
myapp.api.post.400
myapp.api.post.500
myapp.api.all.200
myapp.api.all.400
myapp.api.all.500
To add all response codes of myapp.api.get to a chart use this:
[api_get_responses]
   ...
   dimension = pattern 'myapp.api.get.* '' last 1 1
The above will add dimension named 200, 400 and 500 (yes, netdata extracts the wildcarded part of the metric name - so the dimensions will be named with whatever the * matched). You can rename the dimensions with this:
[dictionary]
    get.200 = 200 ok
    get.400 = 400 bad request
    get.500 = 500 cannot connect to db

[api_get_responses]
   ...
   dimension = pattern 'myapp.api.get.* 'get.' last 1 1
Note that we added a NAME to the dimension line with get.. This is prefixed to the wildcarded part of the metric name, to compose the key for looking up the dictionary. So 500 became get.500 which was looked up to the dictionary to find value 500 cannot connect to db. This way we can have different dimension names, for each of the API methods (i.e. get.500 = 500 cannot connect to db while post.500 = 500 cannot write to disk).
To add all API methods to a chart, do this:
[ok_by_method]
   ...
   dimension = pattern 'myapp.api.*.200 '' last 1 1
The above will add get, post, del and all to the chart.
If all is not wanted (a stacked chart does not need the all dimension, since the sum of the dimensions provides the total), the line should be:
[ok_by_method]
   ...
   dimension = pattern '!myapp.api.all.* myapp.api.*.200 '' last 1 1
With the above, all methods except all will be added to the chart.
To automatically rename the methods, use this:
[dictionary]
    method.get = GET
    method.post = ADD
    method.del = DELETE

[ok_by_method]
   ...
   dimension = pattern '!myapp.api.all.* myapp.api.*.200 'method.' last 1 1
Using the above, the dimensions will be added as GET, ADD and DELETE.
If you send just one value to statsd, you will notice that the chart is created but no value is shown. The reason is that netdata interpolates all values at second boundaries. For incremental values (counters and meters in statsd terminology), if you send 10 at 00:00:00.500, 20 at 00:00:01.500 and 30 at 00:00:02.500, netdata will show 15 at 00:00:01 and 25 at 00:00:02.
This interpolation is automatic and global in netdata for all charts, for incremental values. This means that for the chart to start showing values you need to send 2 values across 2 flush intervals.
(although this is required for incremental values, netdata allows mixing incremental and absolute values on the same charts, so this little limitation [i.e. 2 values to start visualization], is applied on all netdata dimensions).
(statsd metrics do not loose their first data collection due to interpolation anymore - fixed with PR #2411)
You can send/update statsd metrics from shell scripts. You can use this feature, to visualize in netdata automated jobs you run on your servers.
The command you need to run is:
echo "NAME:VALUE|TYPE" | nc -u --send-only localhost 8125Where:
NAMEis the metric nameVALUEis the value for that metric (gauges|g, timers|msand histograms|haccept decimal/fractional numbers, counters|cand meters|maccept integers, sets|saccept anything)TYPEis one ofg,ms,h,c,m,sto select the metric type.
So, to set metric1 as gauge to value 10, use:
echo "metric1:10|g" | nc -u --send-only localhost 8125To increment metric2 by 10, as a counter, use:
echo "metric2:10|c" | nc -u --send-only localhost 8125You can send multiple metrics like this:
# send multiple metrics via UDP
printf "metric1:10|g\nmetric2:10|c\n" | nc -u --send-only localhost 8125
Remember, for UDP communication each packet should not exceed the MTU. So, if you plan to push too many metrics at once, prefer TCP communication:
# send multiple metrics via TCP
printf "metric1:10|g\nmetric2:10|c\n" | nc --send-only localhost 8125
You can also use this little function to take care of all the details:
#!/usr/bin/env bash

STATSD_HOST="localhost"
STATSD_PORT="8125"
statsd() {
	local udp="-u" all="${*}"

        # if the string length of all parameters given is above 1000, use TCP
        [ "${#all}" -gt 1000 ] && udp=

        while [ ! -z "${1}" ]
        do
          	printf "${1}\n"
                shift
        done | nc ${udp} --send-only ${STATSD_HOST} ${STATSD_PORT} || return 1

        return 0
}
You can use it like this:
# first, source it in your script
source statsd.sh

# then, at any point:
statsd "metric1:10|g" "metric2:10|c" ...
The function is smart enough to call nc just once and pass all the metrics to it. It will also automatically switch to TCP if the metrics to send are above 1000 bytes.