Plugin for Grafana to implement an "app" to provide screens for viewing or configuring parts of Monasca which do not fit the traditional dashboard format. It is intended for deployments of Monasca which for whatever reason do not have the Horizion UI component of Monasca deployed, e.g.
- Monitoring of non-OpenStack systems (e.g. Kubernetes) or bare-metal
- Inability/unwillingness to modify pre-existing Horizon deployment
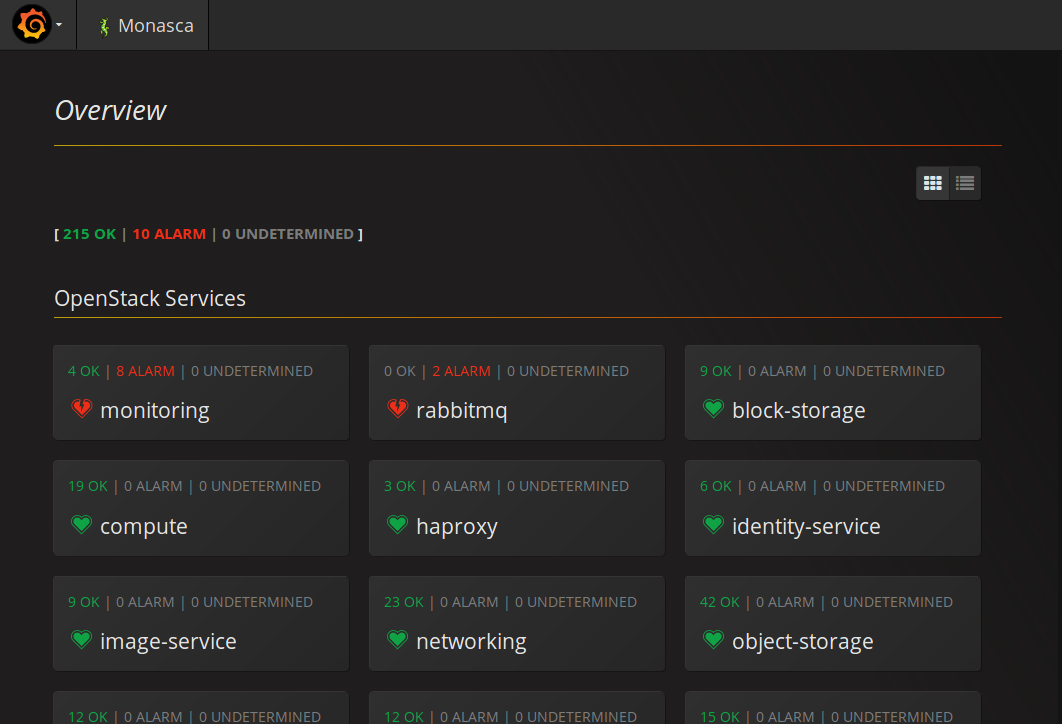
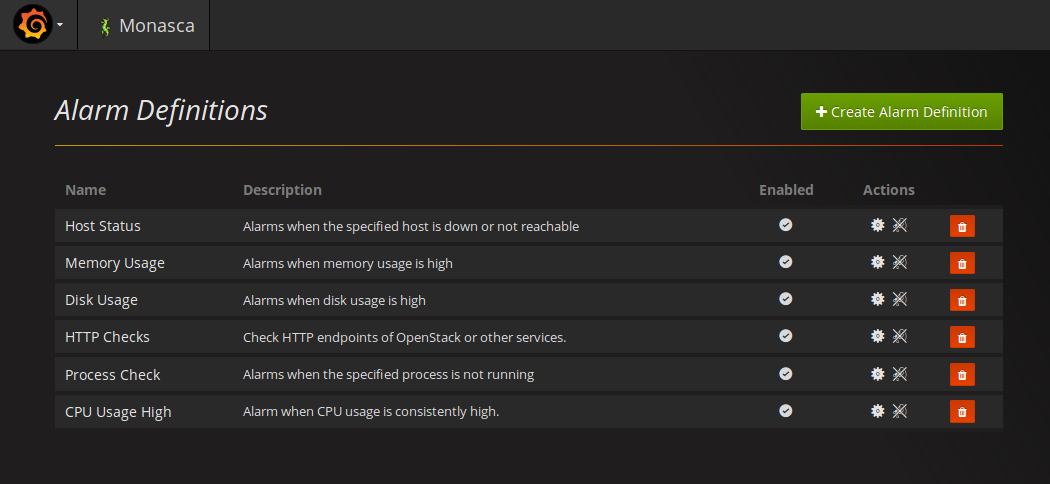
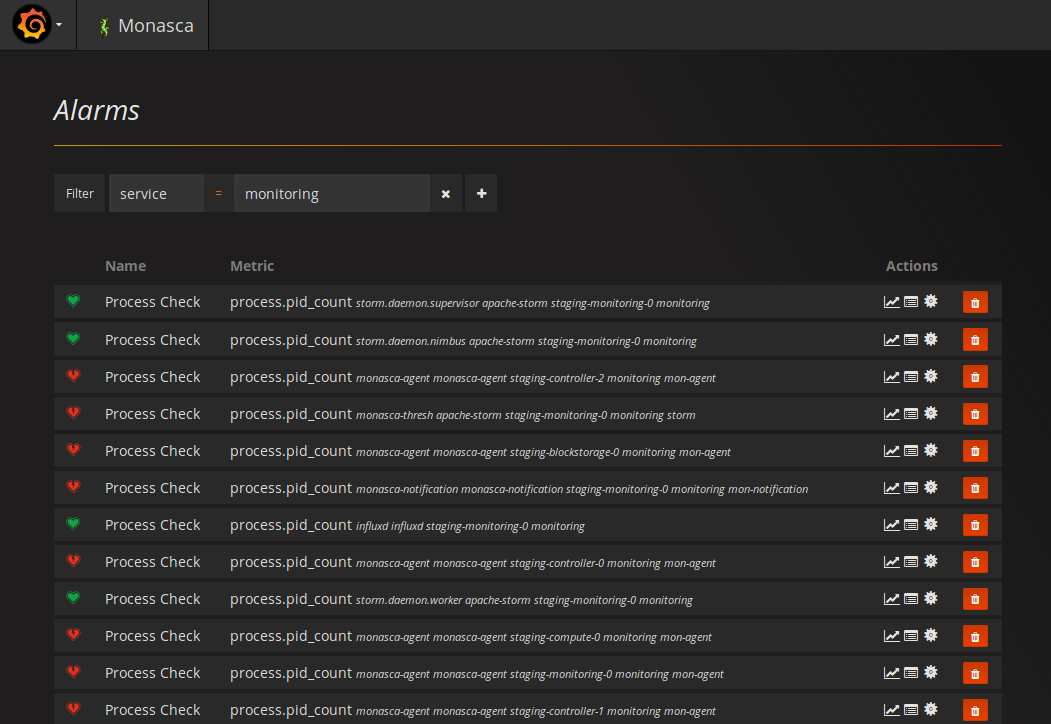
The design is intended to roughly follow that of the Monasca Horizon UI component. This currently includes the ability to view and configure:
- Alarm Definitions
- Alarms
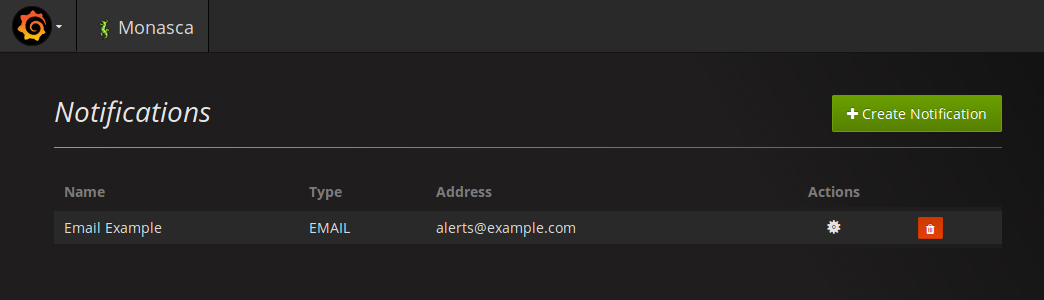
- Notifications
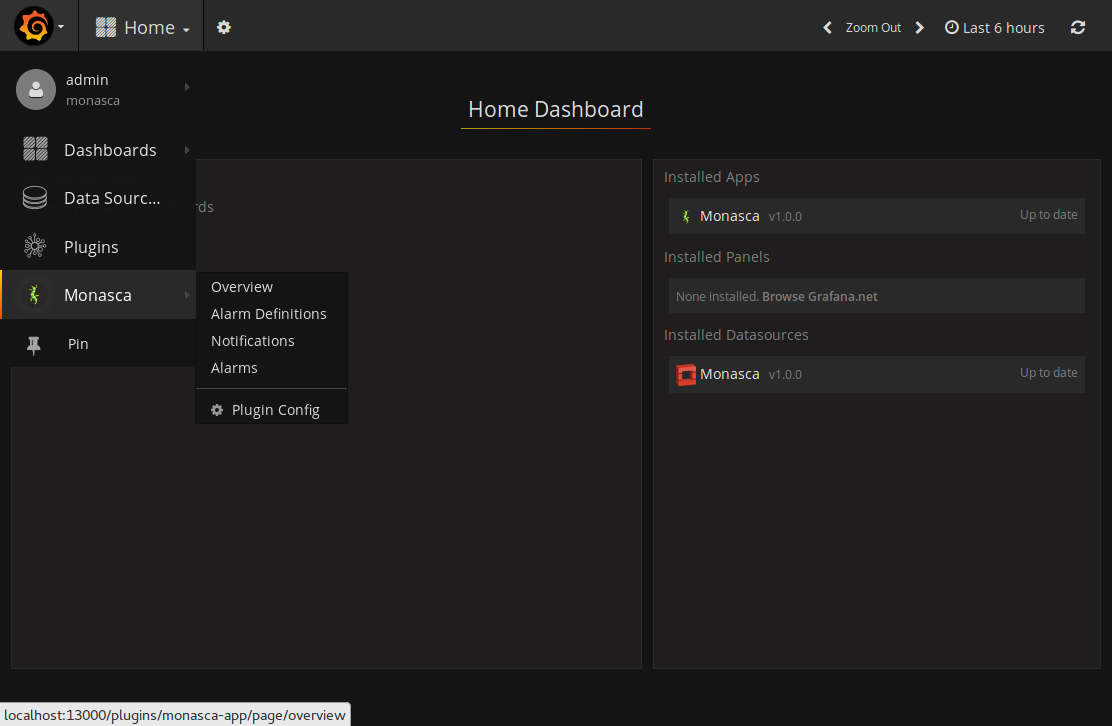
To install into an existing Grafana deployment, firstly ensure the Monasca datasource plugin for Grafana is deployed and operational. This will be used to proxy requests to the monasca-api services. Having that in place, do the following:
sudo git clone https://github.com/monasca/monasca-grafana /var/lib/grafana/plugins/monasca-grafana-app
sudo service grafana-server restart
Navigate to the "Plugins" screen of Grafana, then to the "Apps" section. Choose to enable the Monasca app, and select the datasource you would like to use as a means of accessing the monasca-api service.
Install system dependencies (these work for Ubuntu 16.04):
sudo apt-get install nodejs nodejs-legacy npm
Navigate to source directory and install grunt locally (not system-wide).
npm install grunt
npm install grunt-cli
Fetch project-specific dependencies:
npm install
To build:
./node_modules/.bin/grunt