Visualization dashboard for coronavirus pandemic built with Ruby-On-Rails and VueJS
Coviz19 is a visualization dashboard for coronavirus spread.
It is built as a Ruby-On-Rails 6 API and VueJS front-end.
It currently provides an interactive map and several sets of charts. The data used is sourced from John Hopkins University. A script downloads the data from the CSV files on this repository and stores it in the database.
In your development environment, the scripts must be executed as explained below.
Make sure you have the following softwares:
- Brew on Mac OS X to install the following softwares (instructions here)
- Curl to download example files (
brew install curlon Mac OS X or more instructions here) - Git to download the application source code (
brew install giton Mac OS X or more instructions here) - Ruby to run the application (
brew install rubyon Mac OS X or more instructions here) - Postgres is the database used by the application (
brew install postgreson Mac OS X or more instructions here) - Bundler to install the application's dependencies (
gem install bundler)
Clone application:
git clone https://github.com/mbatoul/coviz19.git
cd coviz
Install dependencies:
bundle installcd client && yarn installCreate database schema and run migrations (by default it will be a local database named coviz_dev):
createdb coviz_devrails db:migrateThe database has three tables:
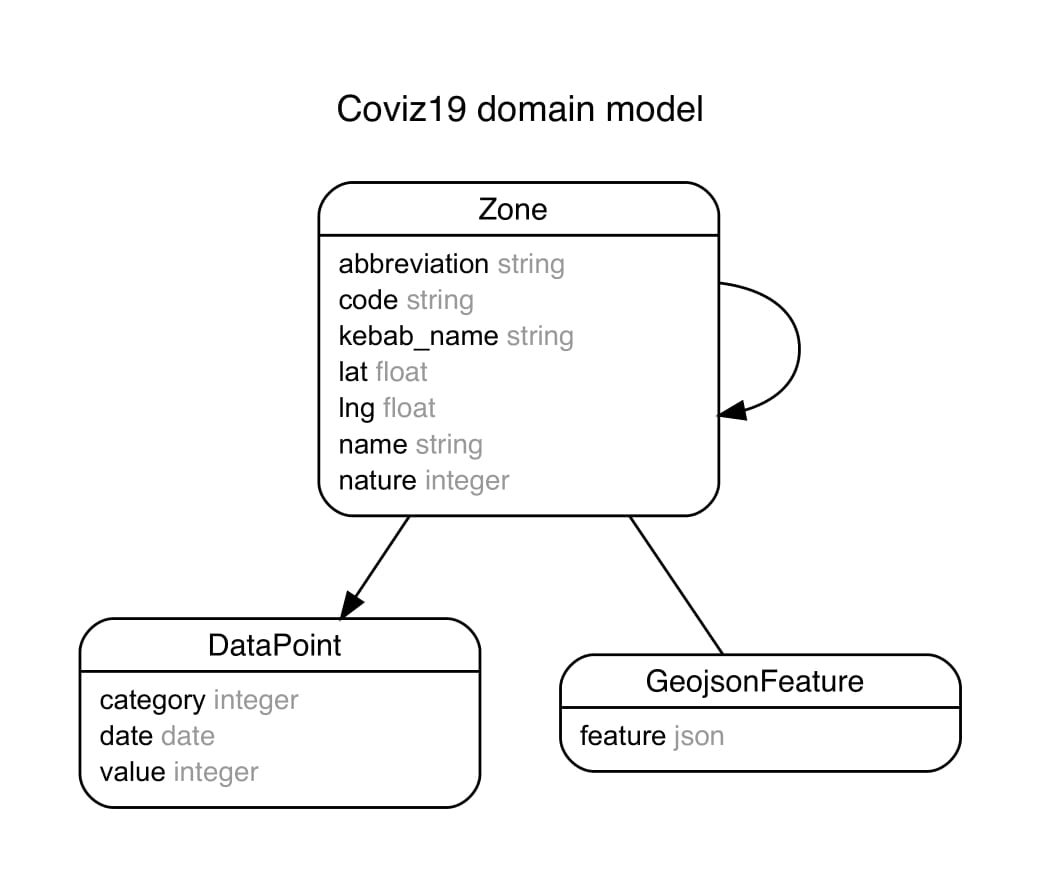
It represents a geographic region on which we have COVID data.
The table is designed to handle different level of granularity using tree based relations with a parent_id.
Currently, a zone has four possible natures: country, province, region and state. country being the current highest level division, any lower level division within this country will reference the corresponding country record.
For instance, the country zone China has_many children of nature province.
It represents a point of data in a single zone at a precise date in a single category. It belongs_to to a zone record.
It has four possible categories:
- Confirmed: the number of confirmed cases. See the data
- Death: the number of deaths? See the data
- Recovered: the number of recoveries. See the data
- Active: the number of current active cases (confirmed - deaths - recovered)
It stores the geographic data displayed on the map. It belongs_to to a zone record.
The COVID data used by Coviz19 is sourced from this repo.
To download the data, use the import_covid_data rake task.
rake import_covid_dataIt currently successively downloads the following CSV files and format the data in order to fit the database schema.
Finds or creates the corresponding zone record for each line and creates a data_point of category confirmed for each column.
Finds or creates the corresponding zone record for each line and creates a data_point of category death for each column.
Finds or creates the corresponding zone record for each line and creates a data_point of category recovered for each column.
It also creates a data_point of category active for each date. Its value is calculated as confirmed - death - recovered of each zone at a precise date.
Use the import_geojson_features rake task
rake import_geojson_featuresIt downloads 232 GeoJSON features from a remote AWS S3 bucket, find the corresponding zone record and stores the GeoJSON in the geojson_features table.
The rake task start executes our Procfile.dev file that runs our API and client servers.
rake start