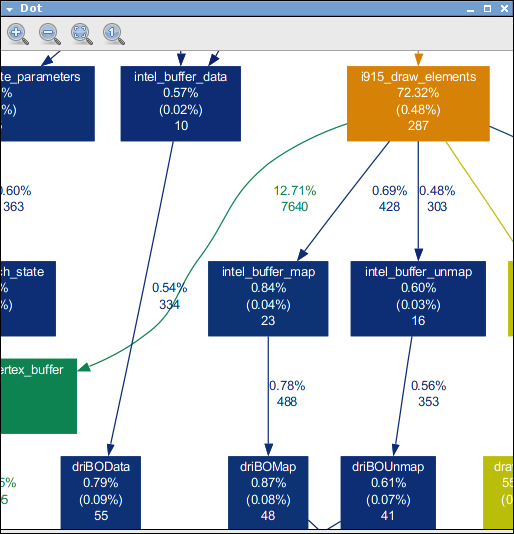
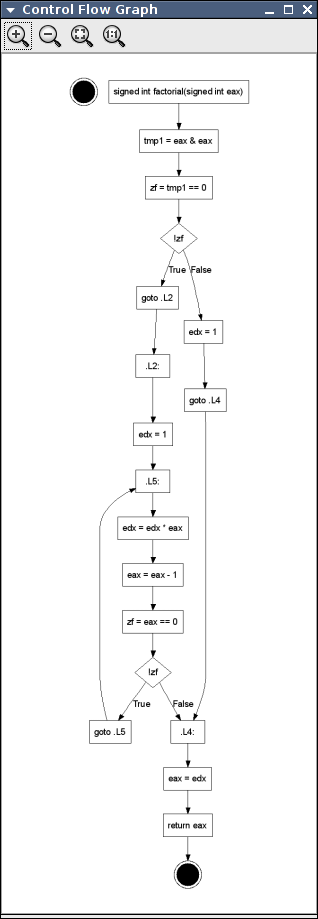
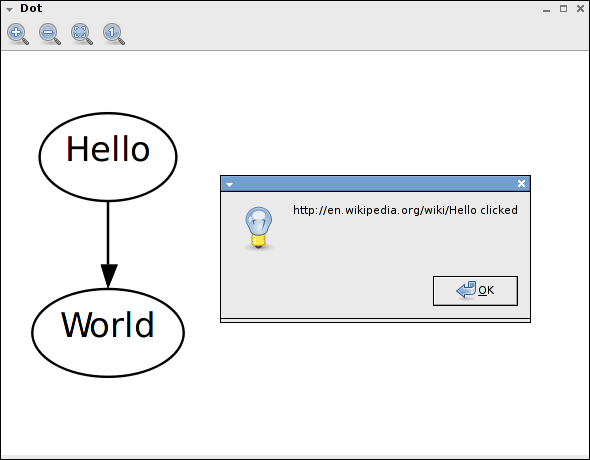
xdot.py is an interactive viewer for graphs written in Graphviz's dot language.
It uses internally the graphviz's xdot output format as an intermediate format, and PyGTK and Cairo for rendering.
xdot.py can be used either as a standalone application from command line, or as a library embedded in your python application.
xdot.py script became much more popular than I ever anticipated, and there are several interested in improving it further. However, for several years now, xdot.py already meets my own needs, and unfortunately I don't have much time for maintain it myself.
So I'm looking into transition xdot.py maitenance to others: either hand over the maintenance xdot.py to a community or indicate an official fork of xdot.py.
I encourage people interested in development of xdot.py to fork the GitHub repository, and join the new mailing list.
- Since it doesn't use bitmaps it is fast and has a small memory footprint.
- Arbitrary zoom.
- Keyboard/mouse navigation.
- Supports events on the nodes with URLs.
- Animated jumping between nodes.
- Highlights node/edge under mouse.
-
Not all xdot attributes are supported or correctly rendered yet. It works well for my applications but YMMV.
-
Text doesn't scale properly to large sizes if font hinting is enabled. I haven't find a reliable way to disable font hinting during rendering yet.
See also:

Download and install:
Run:
apt-get install python-gtk2 graphviz
Usage:
	xdot.py [file]

Options:
  -h, --help            show this help message and exit
  -f FILTER, --filter=FILTER
                        graphviz filter: dot, neato, twopi, circo, or fdp
                        [default: dot]
  -n, --no-filter       assume input is already filtered into xdot format (use
                        e.g. dot -Txdot)

Shortcuts:
  Up, Down, Left, Right     scroll
  PageUp, +, =              zoom in
  PageDown, -               zoom out
  R                         reload dot file
  F                         find
  Q                         quit
  P                         print
  Escape                    halt animation
  Ctrl-drag                 zoom in/out
  Shift-drag                zooms an area
If no input file is given then it will read the dot graph from the standard input.
See included example.py script for an example of how to embedded xdot.py into another application.
-
ZGRViewer -- another superb graphviz/dot viewer
-
dot2tex -- python script to convert xdot output from Graphviz to a series of PSTricks or PGF/TikZ commands.
-
The pypy project also includes an interactive dot viewer based on graphviz's plain format and the pygame library.