This is a simple demo of signal visualization using Python and Drawille
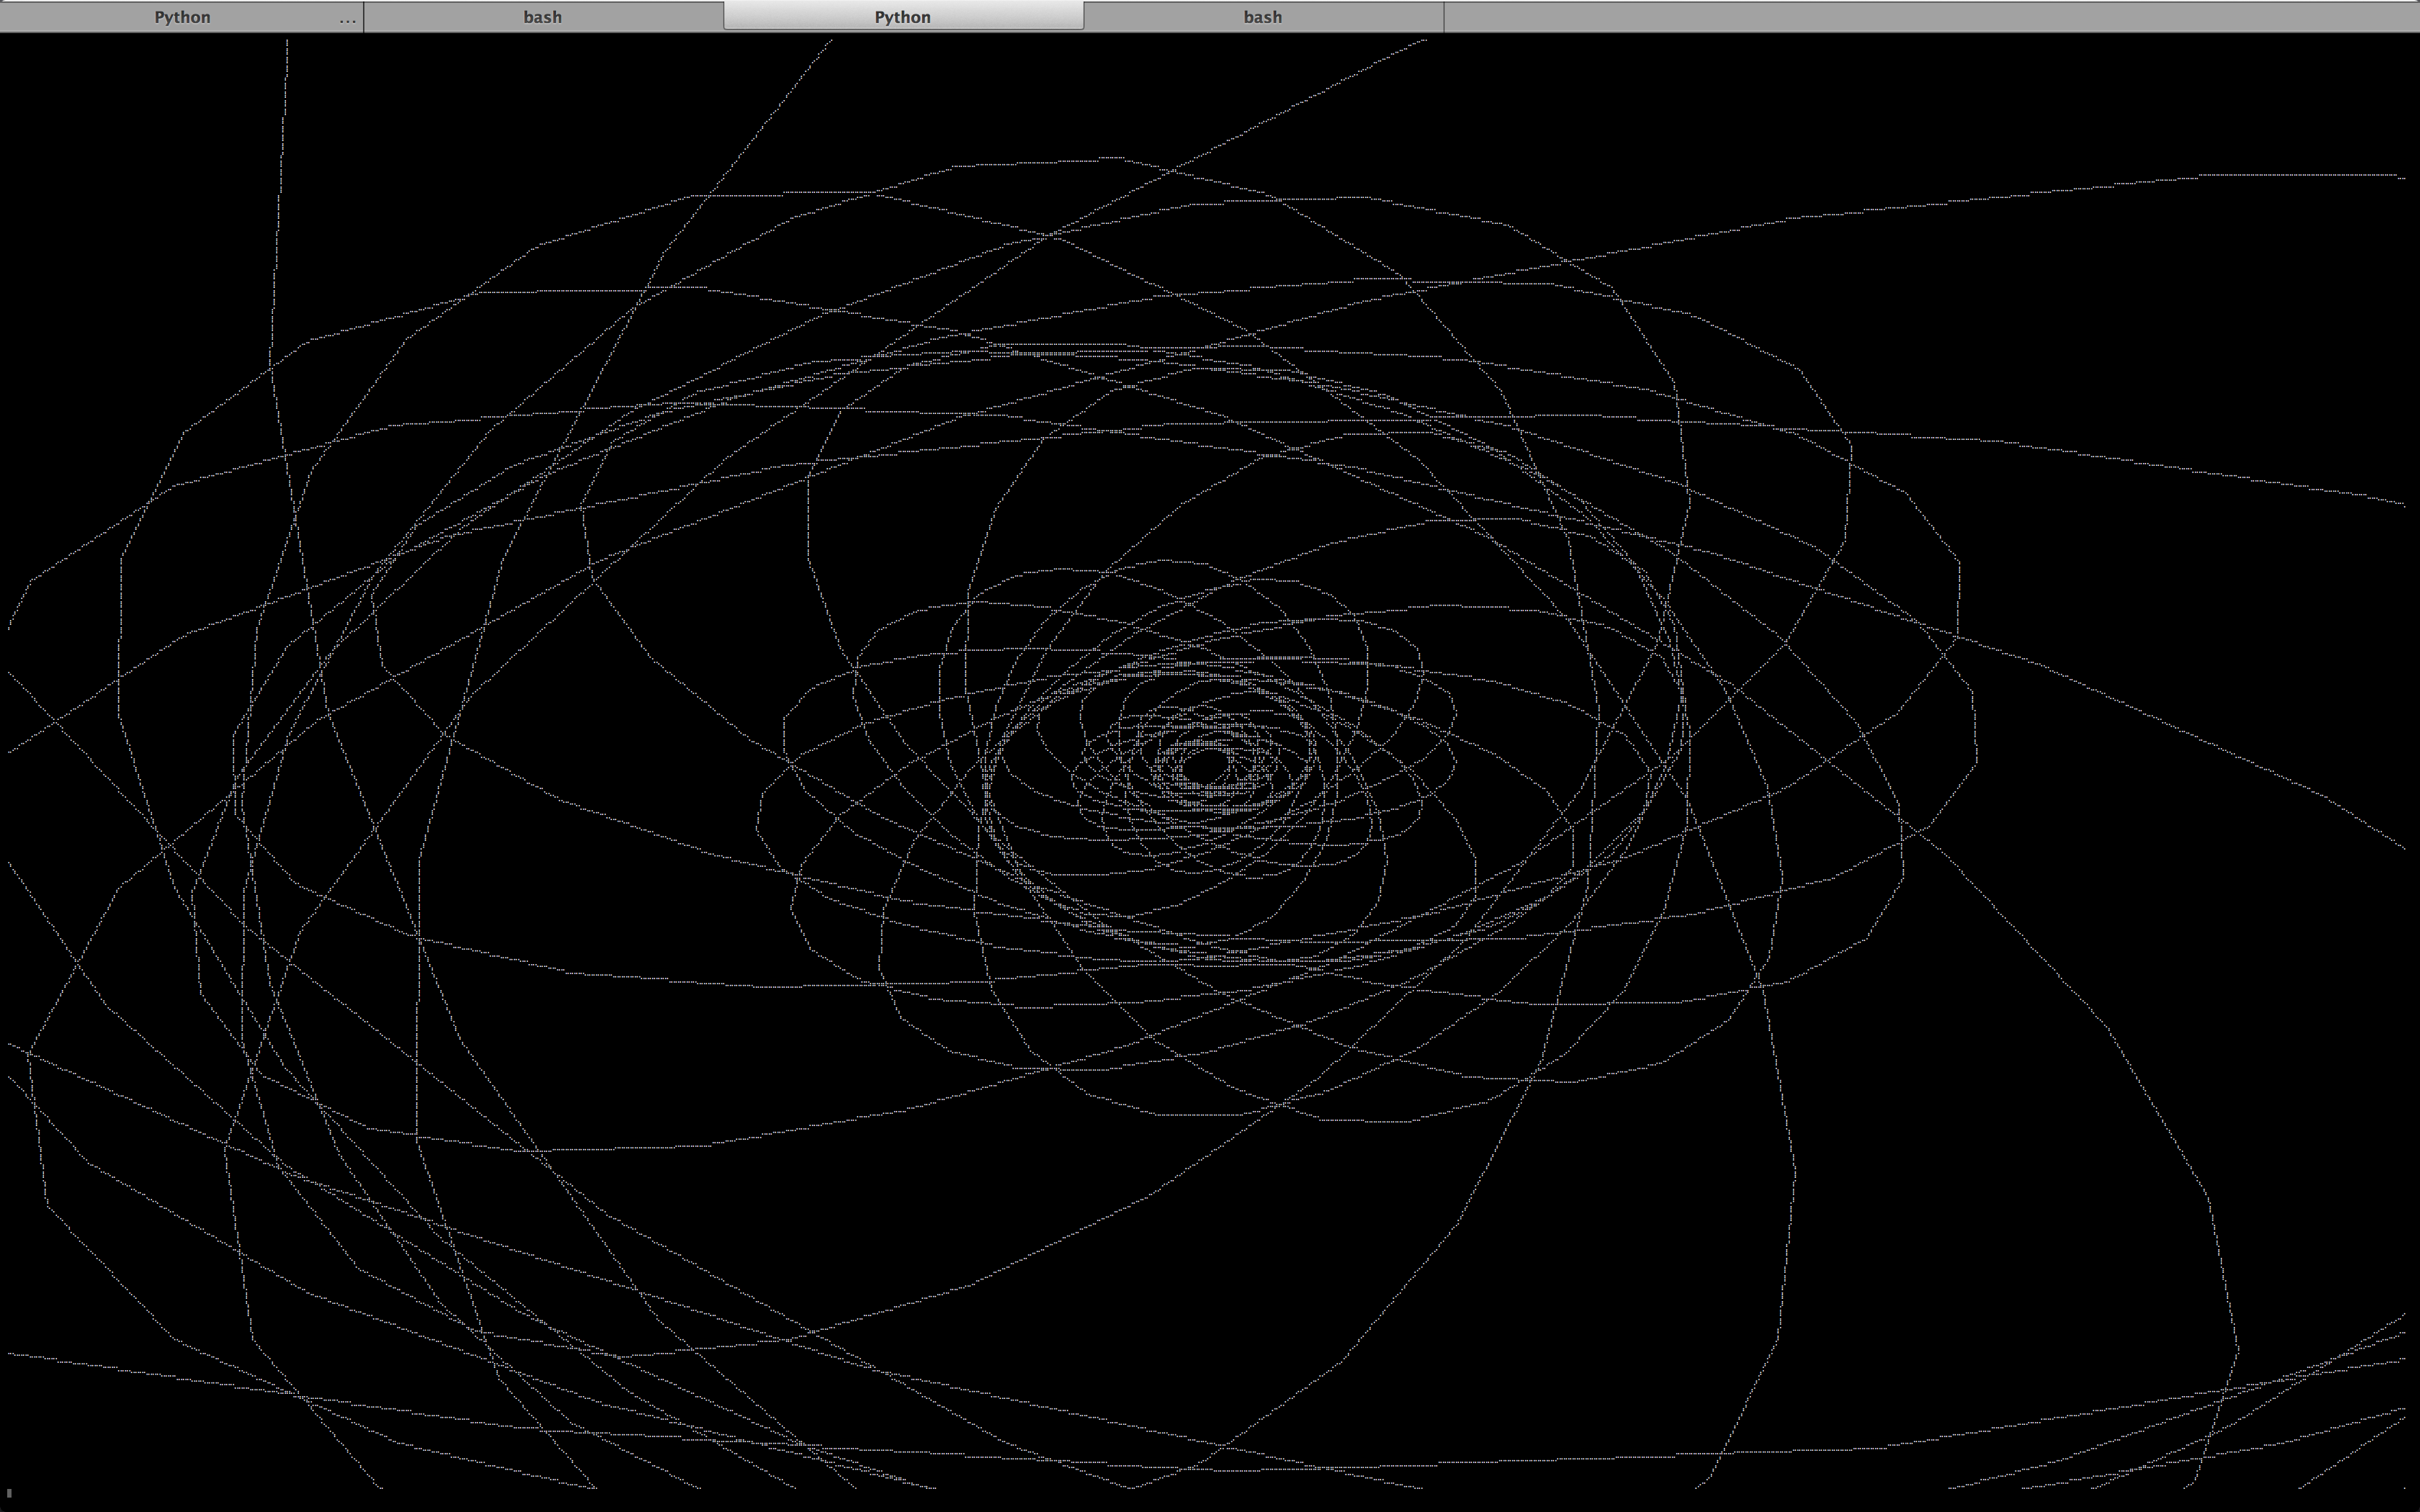
Spiffo animates a fractal spirograph of exponentially decaying sinusoids with varying frequency and phase, interfering with one another in the complex plane. The result is a single continuous curve that exhibits fascinating visual patterns.
Spiffo-Drawille contains several configurable settings in spiffo.py that allows a developer to tweak various parameters:
- a1,a2,a3 - amplitude; higher values equal bigger waves.
- c1,c2,c3 - decay; values closer to 0 cause the sinusoid(s) to more quickly decay.
- w1,w2,w3 - frequency: higher absolute values cause the sinusoid(s) to vary more quickly; values can be positive or negative.
- dw1,dw2,dw3 - rate of change for frequency parameters.
- max_freq - maximum frequency.
- p1,p2,p3 - phase.
- dp1,dp2,dp3 - rate of change for phase parameters.
- depth - scale of z coordinates.
- cycles - number of revolutions (for example, a sinusoid with a frequency of 1 and 3 cycles would produce 1 * 3 circles)
- resolution - samples per cycle: higher values correspond to smoother lines at the expense of CPU time.
A more user-friendly interface may be added in the future.
No explicit build steps are required; simply run spiffo.py:
python spiffo.py
A Javascript/Three.js version of Spiffo can be found here.