This is a simple demo of signal visualization using Three.js.
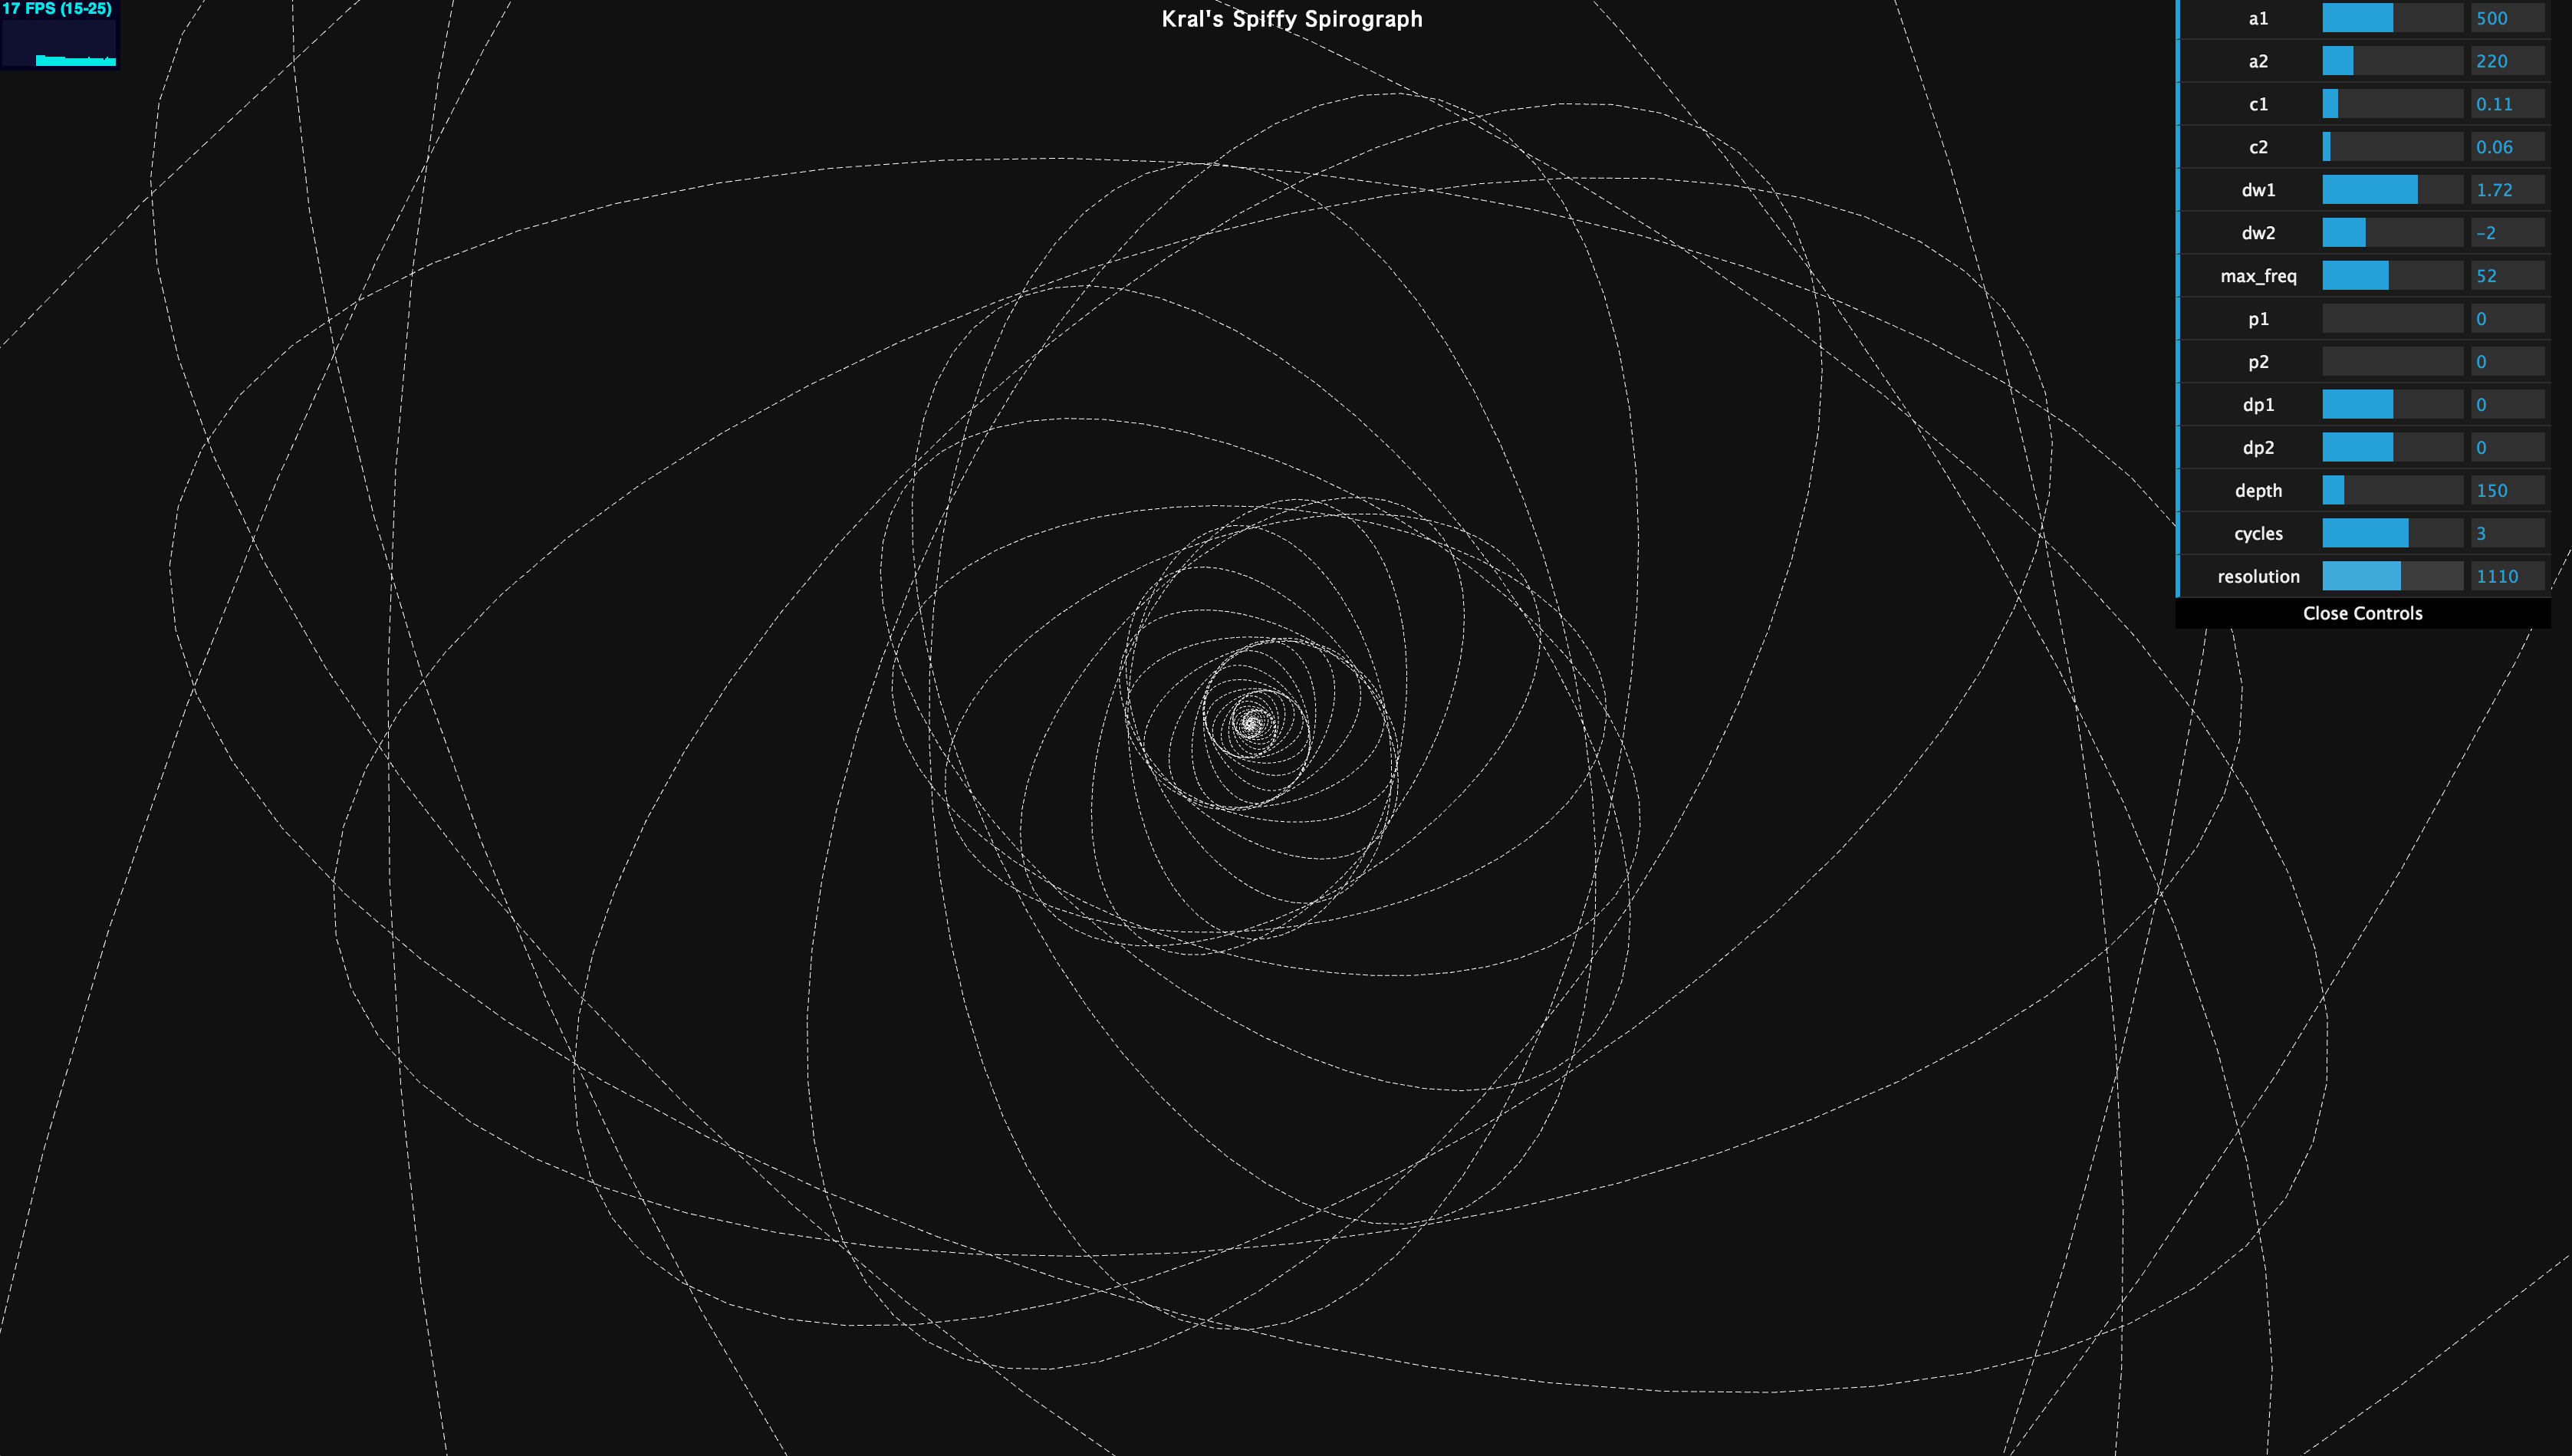
Spiffo animates a fractal spirograph of exponentially decaying sinusoids with varying frequency and phase, interfering with one another in the complex plane. The result is a single continuous curve that exhibits fascinating visual patterns.
Live demo: http://kkroening.github.io/spiffo/
Spiffo includes an on-screen user interface that allows the user to tweak various parameters:
- a1,a2,a3 - amplitude; higher values equal bigger waves.
- c1,c2,c3 - decay; values closer to 0 cause the sinusoid(s) to more quickly decay.
- w1,w2,w3 - frequency: higher absolute values cause the sinusoid(s) to vary more quickly; values can be positive or negative.
- dw1,dw2,dw3 - rate of change for frequency parameters.
- max_freq - maximum frequency.
- p1,p2,p3 - phase.
- dp1,dp2,dp3 - rate of change for phase parameters.
- depth - scale of z coordinates.
- cycles - number of revolutions (for example, a sinusoid with a frequency of 1 and 3 cycles would produce 1 * 3 circles)
- resolution - samples per cycle: higher values correspond to smoother lines at the expense of CPU time.
No explicit build steps are required; simply point your web browser to index.html.
Alternatively, host the code with your favorite web server. For example, to use python's SimpleHTTPServer run the following and point your browser at localhost:8000:
python -m SimpleHTTPServer
A terminal-based Python port of Spiffo can be found here.