

CoinDesk is the world leader in news and information on digital currencies such as bitcoin, and its underlying technology - the blockchain.
They cover news and analysis on the trends, price movements, technologies, companies, and people in the bitcoin as well as digital currency world.
In this exercise, we will be using one of their data repositories: the Bitcoin Price Index. CoinDesk provides a simple API to make its Bitcoin Price Index data programmatically, and we are going to use it to represent the values in a chart.
The Bitcoin Price Index is the value that has bitcoin in different currencies. So we are going to show this variations in a graphic with Chart.js.
👀 ChartJS (also known as chart.js) is an open source library that allows us to create amazing static and animated charts through HTML5 canvas and JavaScript.
- Fork this repo
- Then clone this repo.
- Upon completion, run the following commands
$ git add .
$ git commit -m "done"
$ git push origin master
- Create Pull Request so your TAs can check up your work.
All the files that make your Express app work, including the JavaScript files where you do the Axios requests.
Note that our starter code for this exercise is quite comprehensive. We've already used the Express generator to create the initial project structure. We've also created a JavaScript file to add all your jQuery code.
starter-code/
├── .gitignore
├── app.js
├── bin
│   └── www
├── package.json
├── public
│   ├── images
│   ├── javascripts
│   │   └── financial-data.js
│   └── stylesheets
│       └── style.css
├── routes
│   ├── index.js
└── views
    ├── error.hbs
    └── index.hbs
The app will be a super simple exercise where we are going to represent some data in a line chart.
Let's start!
The first thing we need to do is to get the data we are going to represent in our chart. To do that, we will use the CoinDesk API Documentation.
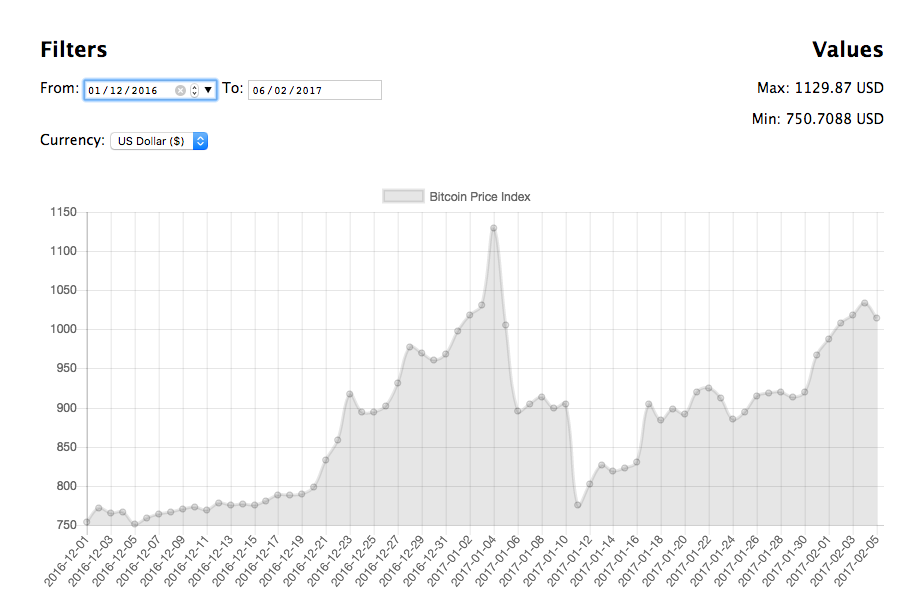
As you can see, you have to do a GET request to the http://api.coindesk.com/v1/bpi/historical/close.json URL, and the response will be a json with the data we want to represent.
As you can see in the image above, the Y-axis will represent the bitcoin value, while the X-axis will represent the date of each value.
We are going to use Axios to do the AJAX Request, so we have to import Axios through it's CDN.
Tasks
- Add the Axios reference in the HTML through CDN to be able to use it.
- You have to create an Axios Request to this URL and get the date. Use a
console.log()to be sure that we are getting the correct data.
Once we have the desired data, we have to show it as a chart. We are going to use Chart.js to do that. So we have to add the library through CDN.
Once we have added the CDN reference in the HTML file, we have to represent the values we got in the Iteration 1 in a Line Chart.
Note: Before you ask for help in the chart representation, try to read the documentation and figure out how it works. :)
Tasks
- Add Chart.js reference through CDN.
- Give the correct format to the data we get in the Iteration 1 to show it in a line chart.
- Practice reading documentation with the Chart line documentation.
- Create a line chart and show the data.
As you can see, by default the API response give us the last month Price Index. In this iteration, we are going to add two date input to be able to filter these dates.
Check out the CoinDesk API documentation (Historical BPI data) to figure out how we can filter the data and get the values between two dates.
To finish up this iteration, remember that the data has to be loaded every time we select a date, so you must add a listener and trigger the load data function every time that the date selector changes its value.
Tasks
- Add two
<input type="date">fields to indicate the dates between which you are going to search: from date - to date. - Add a listener to this
inputto search the data every time that its values changes. - Add the dates to the API URL to get the correct data.
Another option that the API gives us is to get the bitcoin index in an specific currency. By default, the currency is US Dollar (USD). We are going to change that, by adding another filter.
We are going to create a <select> input to allow the user to indicate which currency they want to get the results in. By default, we are going to add two different currencies: USD and EUR.
Feel free to add as many currencies as you like.
As in the dates fiter, the data has to be reloaded every time the currency changes. Again, in the CoinDesk API documentation you can find how to indicate a specific currency.
Tasks
- Add a dropdown to indicate which currency will be shown in the application.
- Add a listener to the
selectfield to reload the data every time its value changes. - Add the currency to the API URL to load the correct values in our application.
To finish up with the exercise, let's add an information box where we are going to show which are the maximum and minimum values in the indicated filters.
To do that we have to get the prices from the response we got in the first iteration and select the max and min values. Once we have these values, we have to show them in the view.
Tasks
- Add an information box in the HTML to show the max/min values from the chart.
- Create an array with the price values from the response.
- Use
Math.min.applyandMath.max.applyto filter the array and get the min/max values. - Show this values in the information box we have added into the view.
Happy coding! ❤️