Home

(originally Google Performance Tools)
The fastest malloc we’ve seen; works particularly well with threads and STL. Also: thread-friendly heap-checker, heap-profiler, and cpu-profiler.
gperftools is a collection of a high-performance multi-threaded
malloc() implementation, plus some pretty nifty performance analysis
tools.
gperftools is distributed under the terms of the BSD License.
For downloads, please visit our Downloads Page.
Note: this is by no means complete documentation, but simply gives you an idea of what the API is like.
No recompilation is necessary to use these tools.
TC Malloc:
gcc [...] -ltcmalloc
Heap Checker:
gcc [...] -o myprogram -ltcmalloc
HEAPCHECK=normal ./myprogram
Heap Profiler:
gcc [...] -o myprogram -ltcmalloc
HEAPPROFILE=/tmp/netheap ./myprogram
Cpu Profiler:
gcc [...] -o myprogram -lprofiler
CPUPROFILE=/tmp/profile ./myprogram
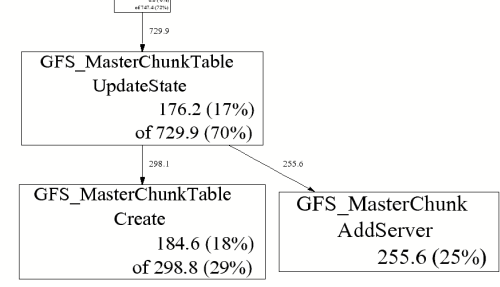
The heap profiler can pop up a window that displays information as a directed graph:
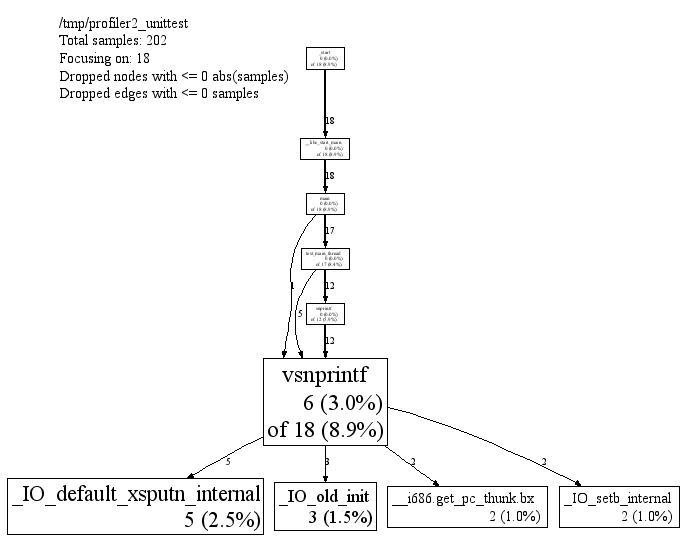
The cpu profiler can produce a weighted call graph:
-
Russ Cox’s gperftools-httpd, a simple http server based on thttpd that enables remote profiling via google-perftool’s pprof.
-
robbinfan’s cloud-perf, a simple web service that enables remote profiling and generate svg/flamegraph via pprof.
If you have questions, comments, or feedback, please direct them to gperftools@googlegroups.com.