![]()
usage: modeplot [-h] [-c CONFIG] [-s N N N] -i STRUCTURE_FILE -e
                EIGENVECTOR_FILE [-g MODE_ID] [--all-gifs] [-j [N]]
                [--print-defaults]

Generate SVG/GIF phonon mode plots from phonopy output.

optional arguments:
  -h, --help            show this help message and exit
  -c CONFIG, --config CONFIG
                        optional render settings config in yaml format
  -s N N N, --supercell N N N
  -i STRUCTURE_FILE, --input STRUCTURE_FILE
                        input structure file (e.g. POSCAR, input.cif)
  -e EIGENVECTOR_FILE, --eigs EIGENVECTOR_FILE
                        eigenvector input file (e.g. band.yaml, qpoints.hdf5,
                        gamma-dynmat*.npz)
  -g MODE_ID, --gif MODE_ID
                        render a single mode gif
  --all-gifs            render all modes as gifs in addition to svgs
  -j [N], --parallel [N]
                        enable parallel processing on N processes, default is
                        number of cores if not specified
  --print-defaults      print default yaml settings to stdout and exit
First install the dependencies via pip by navigating to the pyputil folder and then installing pyputil itself. Note that
you may have to install numpy first (e.g. via python3 -m pip install -r <(grep numpy requirements.txt)) due to an issue
with the phonopy requirement.
# install dependencies
python3 -m pip install -r requirements.txt
# install pyputil module and scripts
python3 -m pip install ./
You can check that it installed correctly by running
modeplot -h
# alternately, the following should work even if your PATH isn't set properly
python3 -m pyputil.bin.modeplot -h
which should show the usage for the modeplot command.
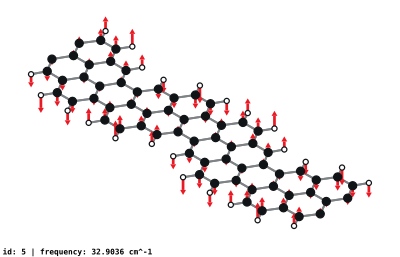
The modeplot command works by reading VASP POSCAR
files in combination with YAML output from phonopy to generate
phonon mode plots.
# periodic with variable supercell size
modeplot --eigs 5agnr.yaml --input 5agnr.vasp --supercell 2 1 1
# finite size (e.g. molecules) with a gzip yaml file
modeplot --eigs 7agnr_l12.yaml.gz --input 7agnr_l12.vasp
# custom config
modeplot --eigs 9agnr_b30.yaml.gz --input 9agnr_b30.vasp --config ./configs/render-settings-9agnr-b.yaml
Default output is in the form mode_N.svg in the current directory where N is the mode number, starting at one.
You can customize the output by supplying a config file as an argument like --config settings.yaml with an example
file below
# how much to translate the structure (in direct coordinates, i.e. multiples
# of the lattice vectors)
translation: [0.0, 0.0, 0.0]
# structure rotation (applied after translation)
rotation:
  - [1, 0, 0]
  - [0, 1, 0]
  - [0, 0, 1]

# image size multiplier
scaling: 30.0
# extra space to add to fit structure in the image
padding: 2.0
# text settings for mode info
draw_info_text: true
info_text_size: 0.5
# background color, can be omitted for transparent background
background_color: '#FFFFFF'

bonds:
  stroke: '#7F8285'
  stroke-width: 0.125
  # whether to draw bonds across periodic bounds
  draw-periodic: false

displacements:
  arrow-width: 0.375
  color: '#EB1923'
  # the largest displacement in a given mode will be scaled to this length
  max-length: 0.75
  stroke-width: 0.125
  # whether to take displacements = -displacements since sometimes
  # those plots look better. can either be boolean true/false, or a list
  # of mode indices which should be inverted (1-indexed)
  invert-direction: false

atom_types:
  C:
    fill: '#111417'
    radius: 0.2607
    stroke: '#111417'
    stroke-width: 0.0834
  H:
    fill: '#FFFFFF'
    radius: 0.1669
    stroke: '#111417'
    stroke-width: 0.0834

# mode animation settings
gif:
  animation-amplitude: 0.45
  num-frames: 32
  frame-delay: 50
usage: structure-gen [-h] {gnr,cnt} ...

Generate various structures, see subcommands for more information

optional arguments:
  -h, --help  show this help message and exit

subcommands:
  {gnr,cnt}
    gnr       generate graphene nanoribbons in POSCAR format
    cnt       generate carbon nanotubes in POSCAR format
usage: structure-gen gnr [-h] [-o OUTPUT] -w N [-l M] [-p]

Generate finite GNR structures in POSCAR format.

optional arguments:
  -h, --help            show this help message and exit
  -o OUTPUT, --output OUTPUT
                        output filename, default is finite-
                        gnr-<width>x<length>.vasp
  -w N, --width N
  -l M, --length M
  -p, --periodic        generate a periodic GNR instead of finite
usage: structure-gen cnt [-h] [-o OUTPUT] -n N -m M

Generate carbon nanotube structures in POSCAR format.

optional arguments:
  -h, --help            show this help message and exit
  -o OUTPUT, --output OUTPUT
                        output filename, default is cnt-<n>x<m>.vasp
  -n N                  chirality
  -m M                  chirality
usage: rsp2-util [-h] {solve-dynmat} ...

Utilities for working with rsp2 and rsp2 output

optional arguments:
  -h, --help      show this help message and exit

subcommands:
  {solve-dynmat}
    solve-dynmat  solve rsp2 dynamical matrix
usage: rsp2-util solve-dynmat [-h] --output OUTPUT DYNMAT

Solve rsp2 dynamical matrix and output eigenvectors/eigenvalues using
numpy.linalg.eigh

positional arguments:
  DYNMAT                dynmat file (sparse npz format, e.g. gamma-
                        dynmat-01.npz)

optional arguments:
  -h, --help            show this help message and exit
  --output OUTPUT, -o OUTPUT
                        frequency/eigenvector output filename (npz format,
                        uses numpy.savez_compressed)