THIS PROJECT IS NO LONGER MAINTAINED. REFER TO THE NEW NAPARI-EPITOOLS: https://github.com/epitools/epitools
CellGraph is a plugin collection for the bioimaging framework icy and allows to transform skeleton images into interactive overlays to explore and analyze your data (examples here). CellGraph is part of the EpiTools project, an open source image analysis toolkit for quantifying epithelial growth dynamics. To know more about the project please visit our project website or the related code repositories:
- EpiTools homepage: https://epitools.github.io
- Image processing part (MATLAB): https://github.com/epitools/epitools-matlab NO LONGER MAINTAINED
If you like CellGraph and use it in your work, please cite our EpiTools paper in Developmental Cell (January 2016), freely available at http://dx.doi.org/10.1016/j.devcel.2015.12.012
The plugins cover subsequent steps of the analysis:
- CellGraph generates the spatiotemporal graph starting from input skeleton files
- CellEditor enables the user to interactively modify the skeleton images manually in case of any remaining segmentation mistakes
- CellOverlay interprets the data and outputs results in the form of graphical overlays (i.e. additional image layers) and tabular files
- CellExporter allows the user to export the complete numerical data in various formats, such as Excel and GraphML
- CellSurface visualizes the VTK files exported by the surface fitting in Matlab
Every plugin has a separate GUI and can be conveniently accessed through the EpiTools toolbar
For detailed instructions (and toolbar installation) we reccomend our wiki page at: https://epitools.github.io/wiki/Icy_Plugins/00_Installation/
But in essence:
- Download the latest cellGraph.zip from the release section of this repository
- Extract the archive
- Place the plugin folder davhelle into the icy plugin folder (e.g. programs/icy/plugins)
- Restart icy and you should see the plugins under tab Plugins > Other Plugins > davhelle
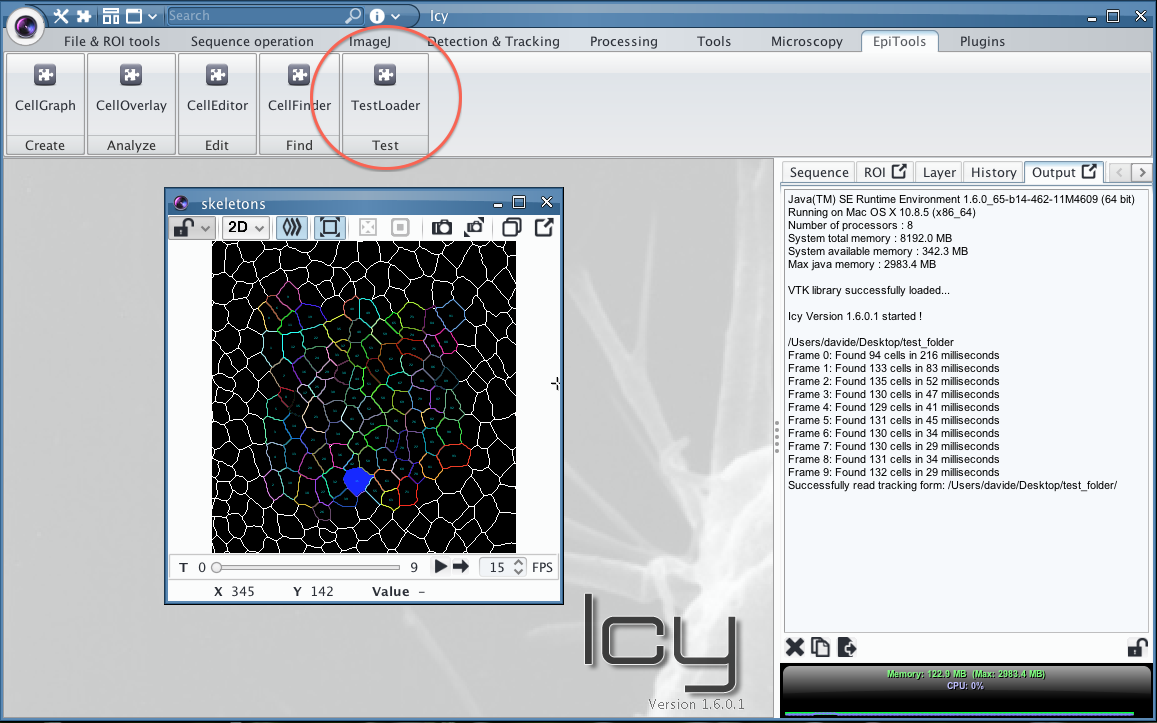
To test the installation, a small example is included in the archive, load it by opening the TestLoader Plugin and select the "test" directory. Now you should see the following (see wiki above to add the toolbar):
CellGraph was developed using the method suggested by the icy developers, which is based on eclipse and allows launching the plugin directly from there.
To get started developing, we suggest editing the TestOverlay. Assuming you have icy and epitools already set up, follow these steps:
- Install eclipse and icy4eclipse
- Pull the epitools plugin master branch from this repo
- Import the eclipse project by creating a new project from the git repository (*)
- Launch the project through the 'D' icon in eclipse toolbar, which should automatically open icy and load the plugin
- Use the test launcher to load the default dataset
- Try modifying an overlay to see interactive changes in the code, for example:
a. load the simple test_overlay via CellOverlay plugin
b. modify the corresponding java file (
/CellGraph/src/plugins/davhelle/cellgraph/overlays/TestOverlay.java), e.g. line 52 from Color.green to Color.red c. return to icy, the centroids should now appear red
(*) specifically eclipse should find the dependencies in the repository:
CellGraph/.projectCellGraph/.classpath
- Davide Heller - design & implementation
- EpiTools team - design
CellGraph is distributed under the GPLv3 license
- In case of bugs or improvement for CellGraph feel free to:
- Create an Issue in this code repository
- Write to Davide Heller
- The Basler Lab and von Mering Lab at IMLS for invaluable feedback
- The Yanlan Mao Lab at UCL for invaluable feedback and extensive testing
- The icy core developers