Profiling .NET MAUI Apps
First, verify you are comparing Release builds of both the Xamarin.Forms and
.NET MAUI applications. The default settings in Debug builds will results in
drastically different performance characteristics.
-
.NET MAUI,
Debug: hasUseInterpreter=trueby default. This enables C# hot reload, which is a very useful feature inDebugmode. -
Xamarin.Forms,
Debug: does not haveUseInterpreter=trueby default.
When comparing Debug builds, you are comparing a JIT-compiled Xamarin.Forms
application versus an interpreted .NET MAUI application. If you are not using
C# hot reload, and it is impacting the development experience of your app, you
could consider disabling the interpeter in Debug mode:
<PropertyGroup>
  <UseInterpreter>false</UseInterpreter>
</PropertyGroup>
This could be useful when debugging math-intensive code, for example.
If you are still experiencing poor performance with a .NET MAUI application in
Release mode:
-
Record a
.nettraceor.speedscopefile using the instructions below. -
File an issue: sharing either the trace or a sample application.
For details about using dotnet trace on specific platforms, see:
PerfView is probably the simplest way to profile a .NET MAUI application running on Windows. We recommend using a Release build with ReadyToRun enabled. See our Windows Publishing Documentation for details about building a Release version of your app.
Begin by selecting the Collect > Collect menu. For a project named hellomaui, you can filter on hellomaui.exe:
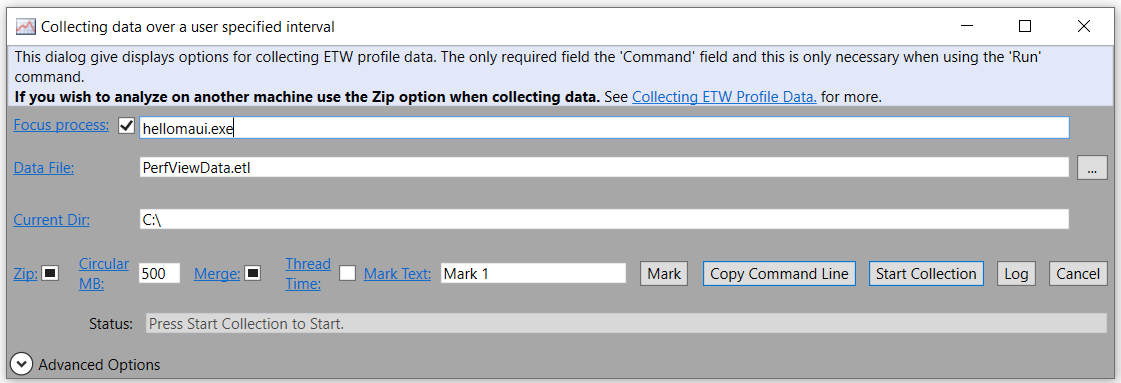
Click Start Collection and manually launch your app.
Click Stop Collection when your app has launched and reached the point you are finished profiling.
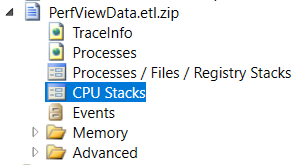
Open CPU Stacks to view timing information of methods inside your app:
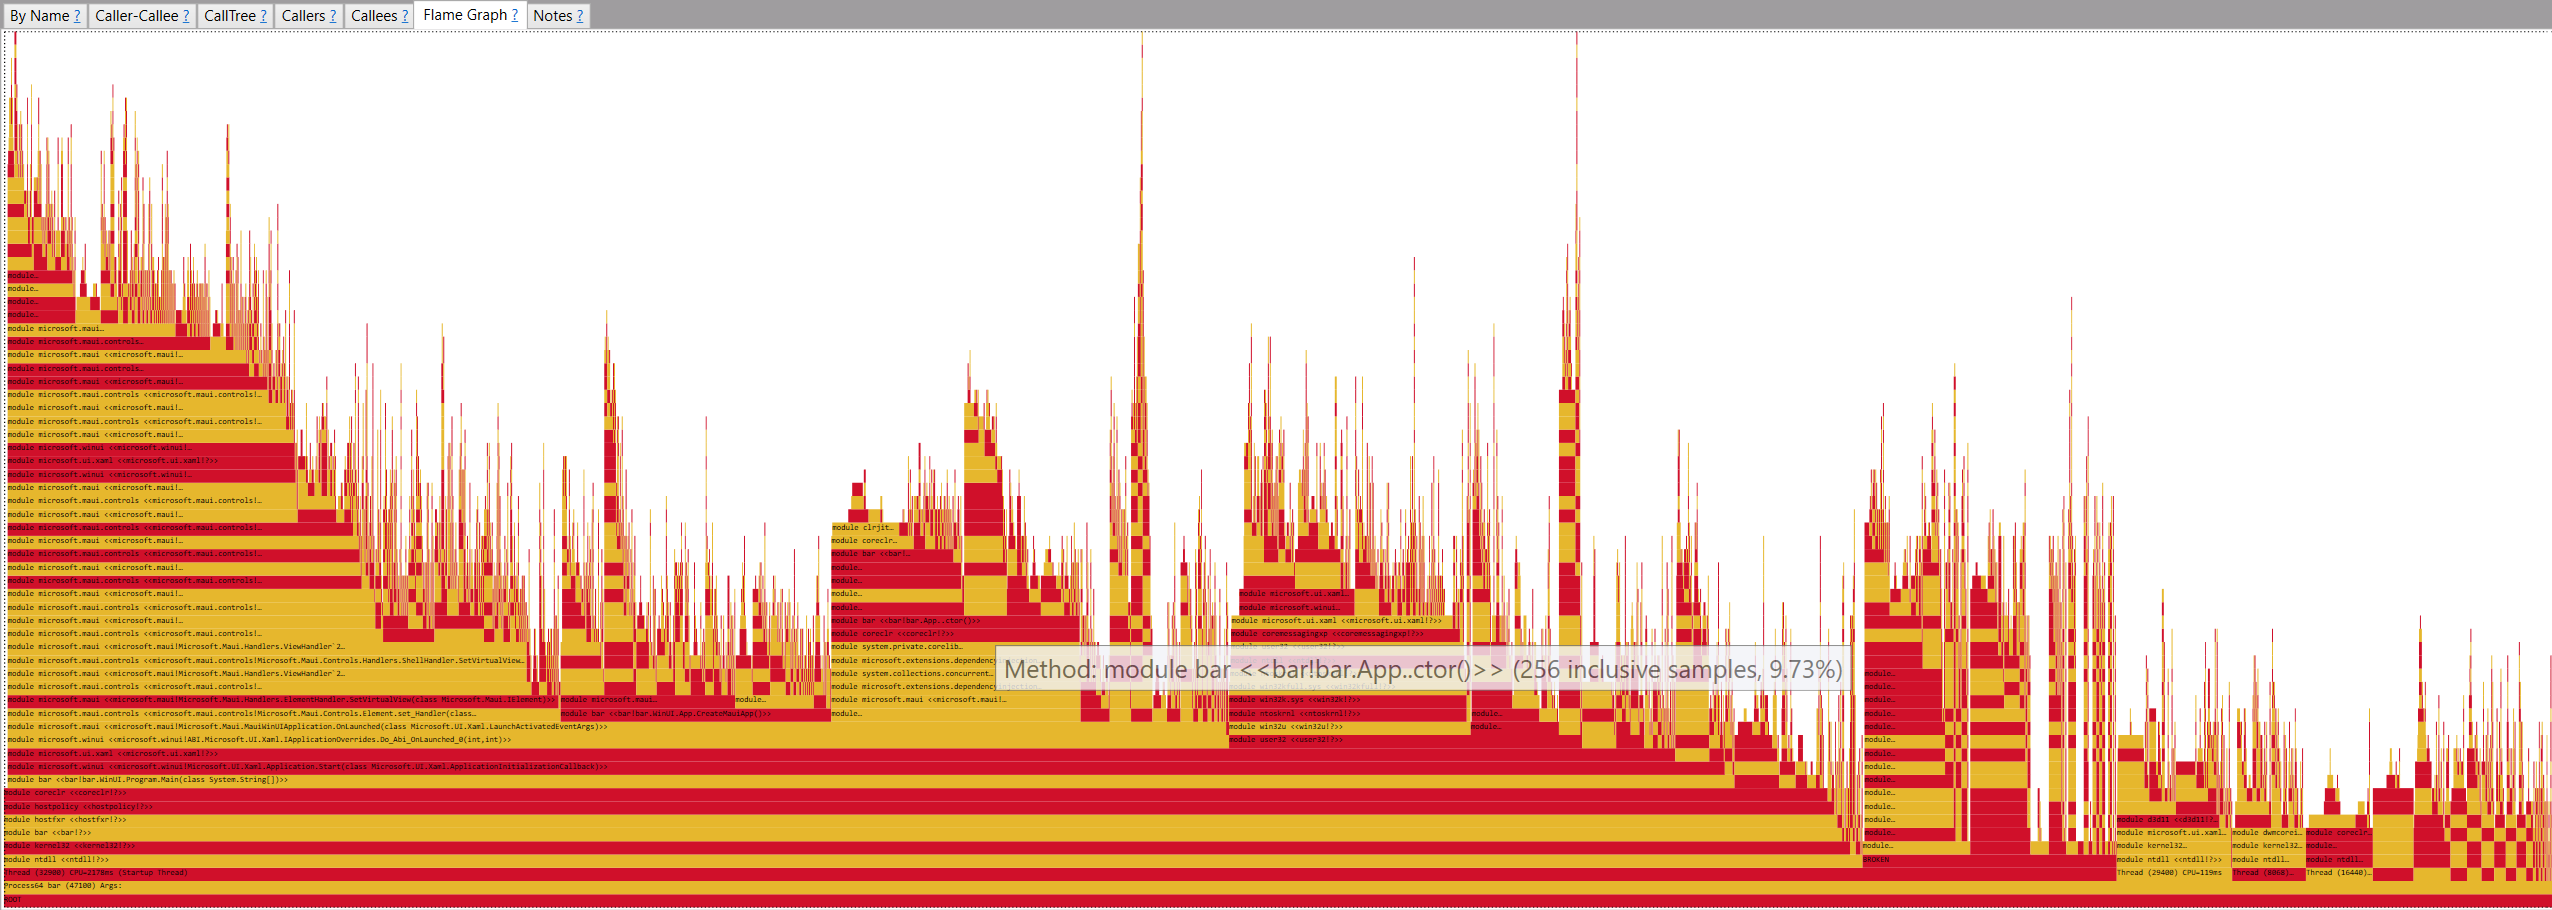
Use the Flame Graph tab for a graphical view:
You can also do File > Save View As to save the file in SpeedScope format. This allows you to open the file in https://speedscope.app/ as we recommend for iOS/Android projects.
You can get a .nettrace or .speedscope file by publishing your app
"unpackaged":
dotnet publish -f net6.0-windows10.0.19041.0 -c Release -p:PublishReadyToRun=true -p:WindowsPackageType=NoneThen run dotnet-trace against the published .exe:
dotnet trace collect -- bin\Release\net6.0-windows10.0.19041.0\win10-x64\publish\YourApp.exeThis will place a .nettrace file in the current directory. You can
also use --format speedscope to open the file in https://speedscope.app/.
To build the profiling app from source, use the local dotnet instance:
./bin/dotnet/dotnet build src/Controls/samples/Controls.Sample.Profiling -f net6.0-android -t:run -c Release -p:IsEmulator=trueThis builds the app and runs it on the device/emulator.
The IsEmulator property can be used to control the environment variables of the app. The main reason is that it uses different ports on the Android device depending on whether it is a local emulator or a connected device.
You may have to build the build tasks for the first run:
./bin/dotnet/dotnet build Microsoft.Maui.BuildTasks-net6.slnfIf a physical device is to be used, then there needs to be a port opened on the Android device via adb:
adb reverse tcp:9000 tcp:9001This commands forwards port 9000 from the device to port 9001 on the host machine.
The same run command can be used for emulators, except that the IsEmulator property should be set to false.
We have a few different useful links & documentation on this subject.
- Android Documentation on Startup
- Xamarin.Android Profiling Overall Startup
- maui-profiling repo: has an example powershell script
One approach is to log a message on startup while measuring the time. See the measure-startup sample for an example of this.
We can also use PerfView to capture specific ETW events related to startup in WindowsAppSdk (and .NET MAUI) applications on Windows. We recommend using a Release build with ReadyToRun enabled. See our Windows Publishing Documentation for details about building a Release version of your app.
Using Collect > Collect menu, as mentioned above, we also need the Advanced Options:
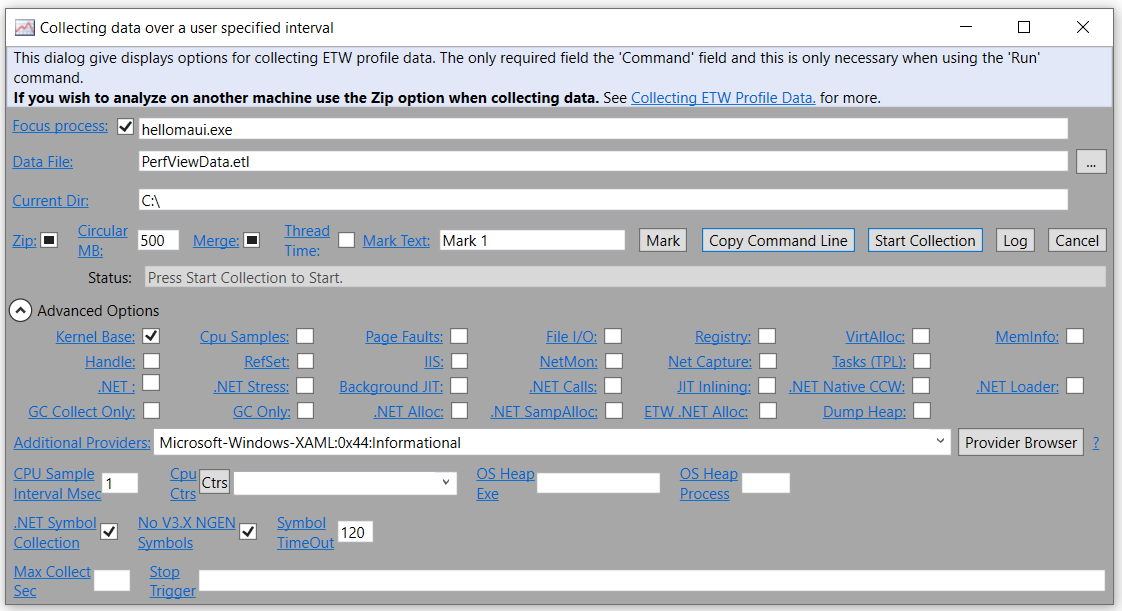
Only record two event types, for measuring the fewest events needed:
- Kernel Base
-
Microsoft-Windows-XAML:0x44:InformationalinAdditional Properties
Each additional event measured will slow down the startup time of your app -- resulting in less-accurate timing.
When collecting, manually launch and close your app 3-5 times before stopping the collection session.
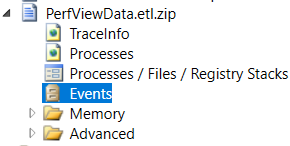
Next, open the Events report, and we'll need to do some math!
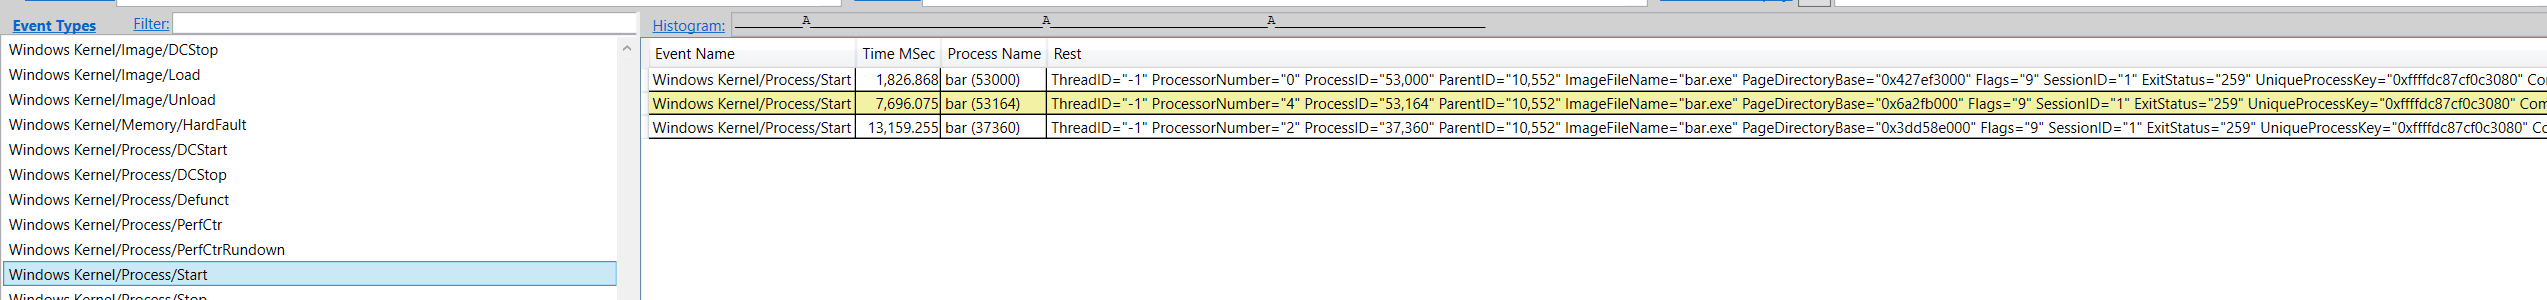
Review the Windows Kernel/Process/Start events and start a Microsoft Excel document. Save the Time MSec and process ID values. for the next step:
Review the Microsoft-Windows-XAML/Frame/Stop events, and find the first instance of each matching each process ID from before:
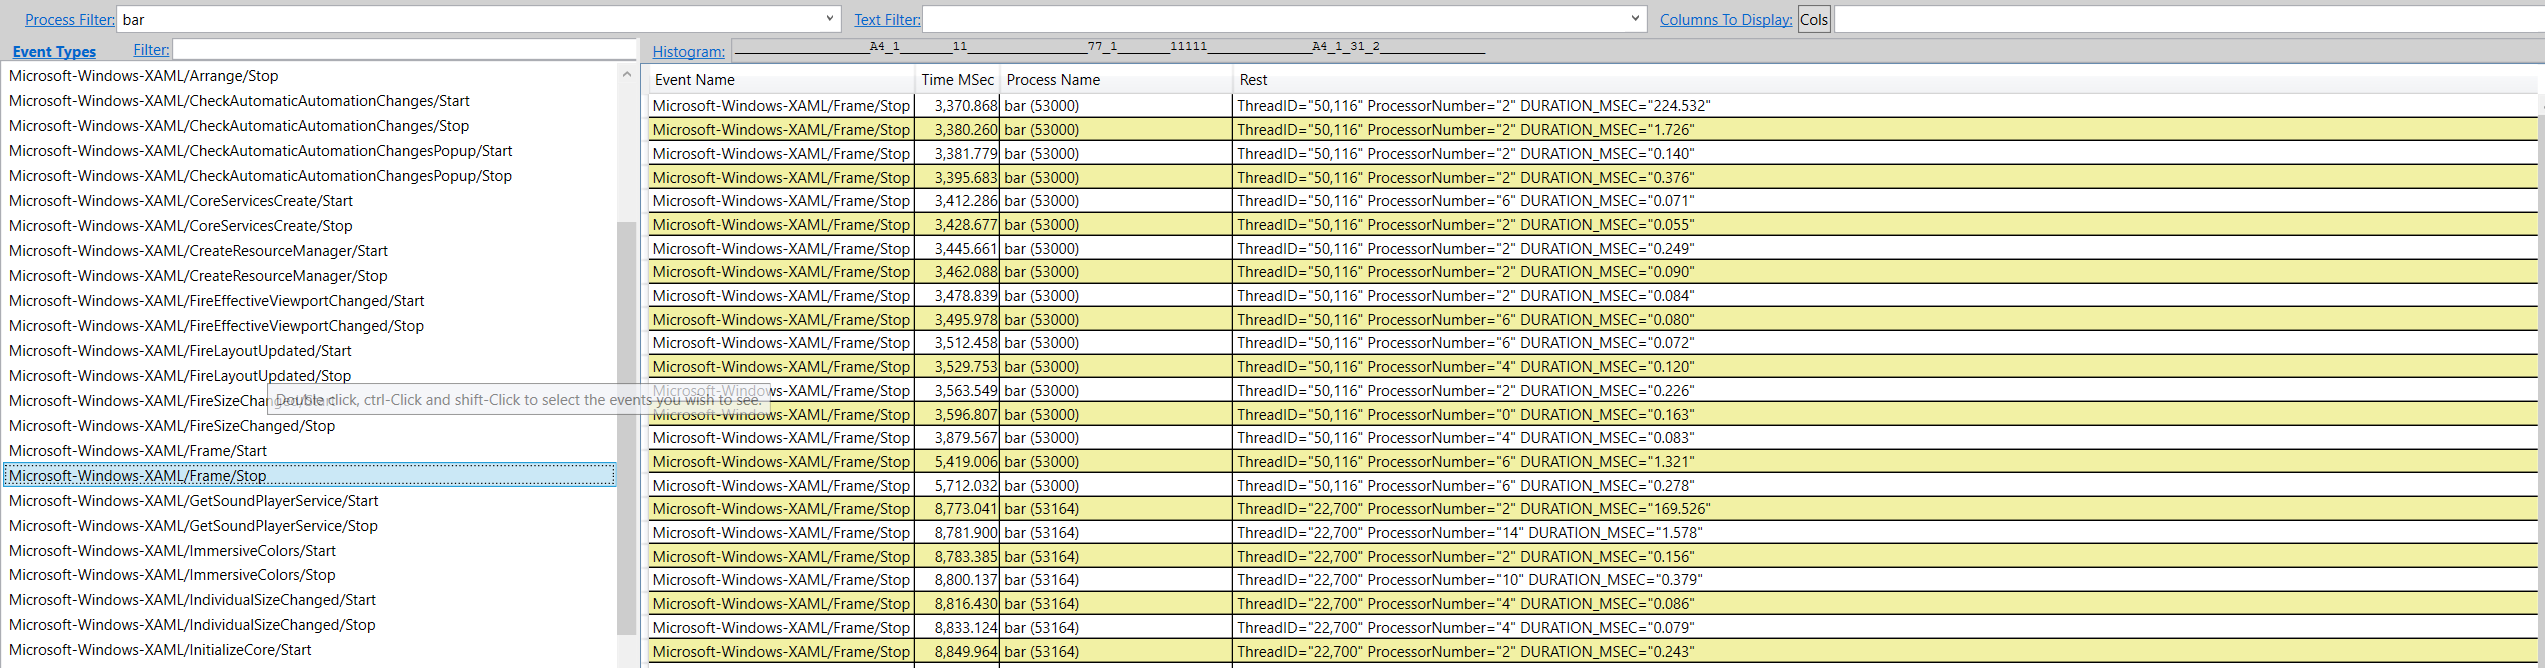
Here I filtered on an app named bar (instead of hellomaui), which matches my project name.
Subtract the value of the first Microsoft-Windows-XAML/Frame/Stop event with a matching process ID of a Windows Kernel/Process/Start event.
So, for example:
- 8,773.041: bar (53164)
- 7,696.075: bar (53164)
8,773.041 - 7,696.075 = 1,076.966 is roughly a 1 second 76 millisecond startup time.
Do this calculation for each run (which is why Excel is nice!) and get an overall average. You might consider throwing out the first time from the average as well.