It's a simple program that reads data from standard input and plots it in real-time like an oscilloscope. It can also do linear regression using the method of least squares to fit polynomials up to degree two to a subset of the data. Aside from calculating coefficients for the polynomials, it also gives the estimate of the standard error of the coefficients. All calculations are numerically stable and use BLAS for the linear algebra backend. It also uses OpenGL for GPU acceleration.
You can either use already compiled binaries for Linux in releases section, or you can compile from source.
To compile from source, you're going to need to install rustup, CMake, gcc, and gfortran for compiling OpenBLAS.
For example, on Arch Linux you can install them easily by using a package manager:
paru -S rustup cmake gcc gcc-fortran
You're also going to need to have your GPU drivers installed.
Once you have everything installed, you have to clone this repository.
git clone https://github.com/svencurkovic/rt-plot.git && cd rt-plot
And finally to compile everything simply run the following command.
cargo build --release
After the compilation is done you can find the compiled binaries in target/release/. There you will find two binaries: rt-plot and rt-relay.
If you've compiled the binaries from source yourself, make sure you either move the binaries to the root directory of the repository or adjust the paths in this section accordingly. Especially if you do not specify a color scheme since rt-plot will look for the default theme in resources/default/....
To use rt-plot, simply run the following command.
./rt-plot --data-config your-data-config.toml
Notice that only one parameter is required, the data configuration file. This configuration file determines everything about the way data is interpreted and plotted. The resources/example-data-config.toml is a kitchensink of all the available options. Note that the [[y]] field can be repeated as many times as there as data channels
For other available arguments, run ./rt-plot --help.
The input rt-plot reads from stdin needs to be formatted as a list of datapoints separated by a newline. Each datapoint is a list of integers separated by space. Here is an example.
432 121 65
453 140 51
...
Where the first integer represents the timestamp and the rest represent values of the signal for each channel.
Program rt-relay is simply a convenient way to read comma separated values from a serial port and output them to the stdout in the format described above.
To read such data from serial port /dev/ttyUSB0, simply run the following command.
./rt-relay read --serial-port /dev/ttyUSB0
For other available arguments, run ./rt-relay --help.
Putting the two programs together, to read data from serial port /dev/ttyUSB0 and plot it using rt-plot, run the following command.
./rt-relay read --serial-port /dev/ttyUSB0 | ./rt-plot --data-config your-data-config.toml
If you also wish to write the incoming data to a file, you can pipe it through tee.
./rt-relay read --serial-port /dev/ttyUSB0 | tee data | ./rt-plot --data-config your-data-config.toml
And if you then wish to replay the data, it can be done via redirection.
./rt-plot --data-config your-data-config.toml < data
Since both programs are cross-platform, this should work on every major OS, however make sure to use correct syntax for piping and redirecting.
| Default dark theme | Default light theme |
|---|---|
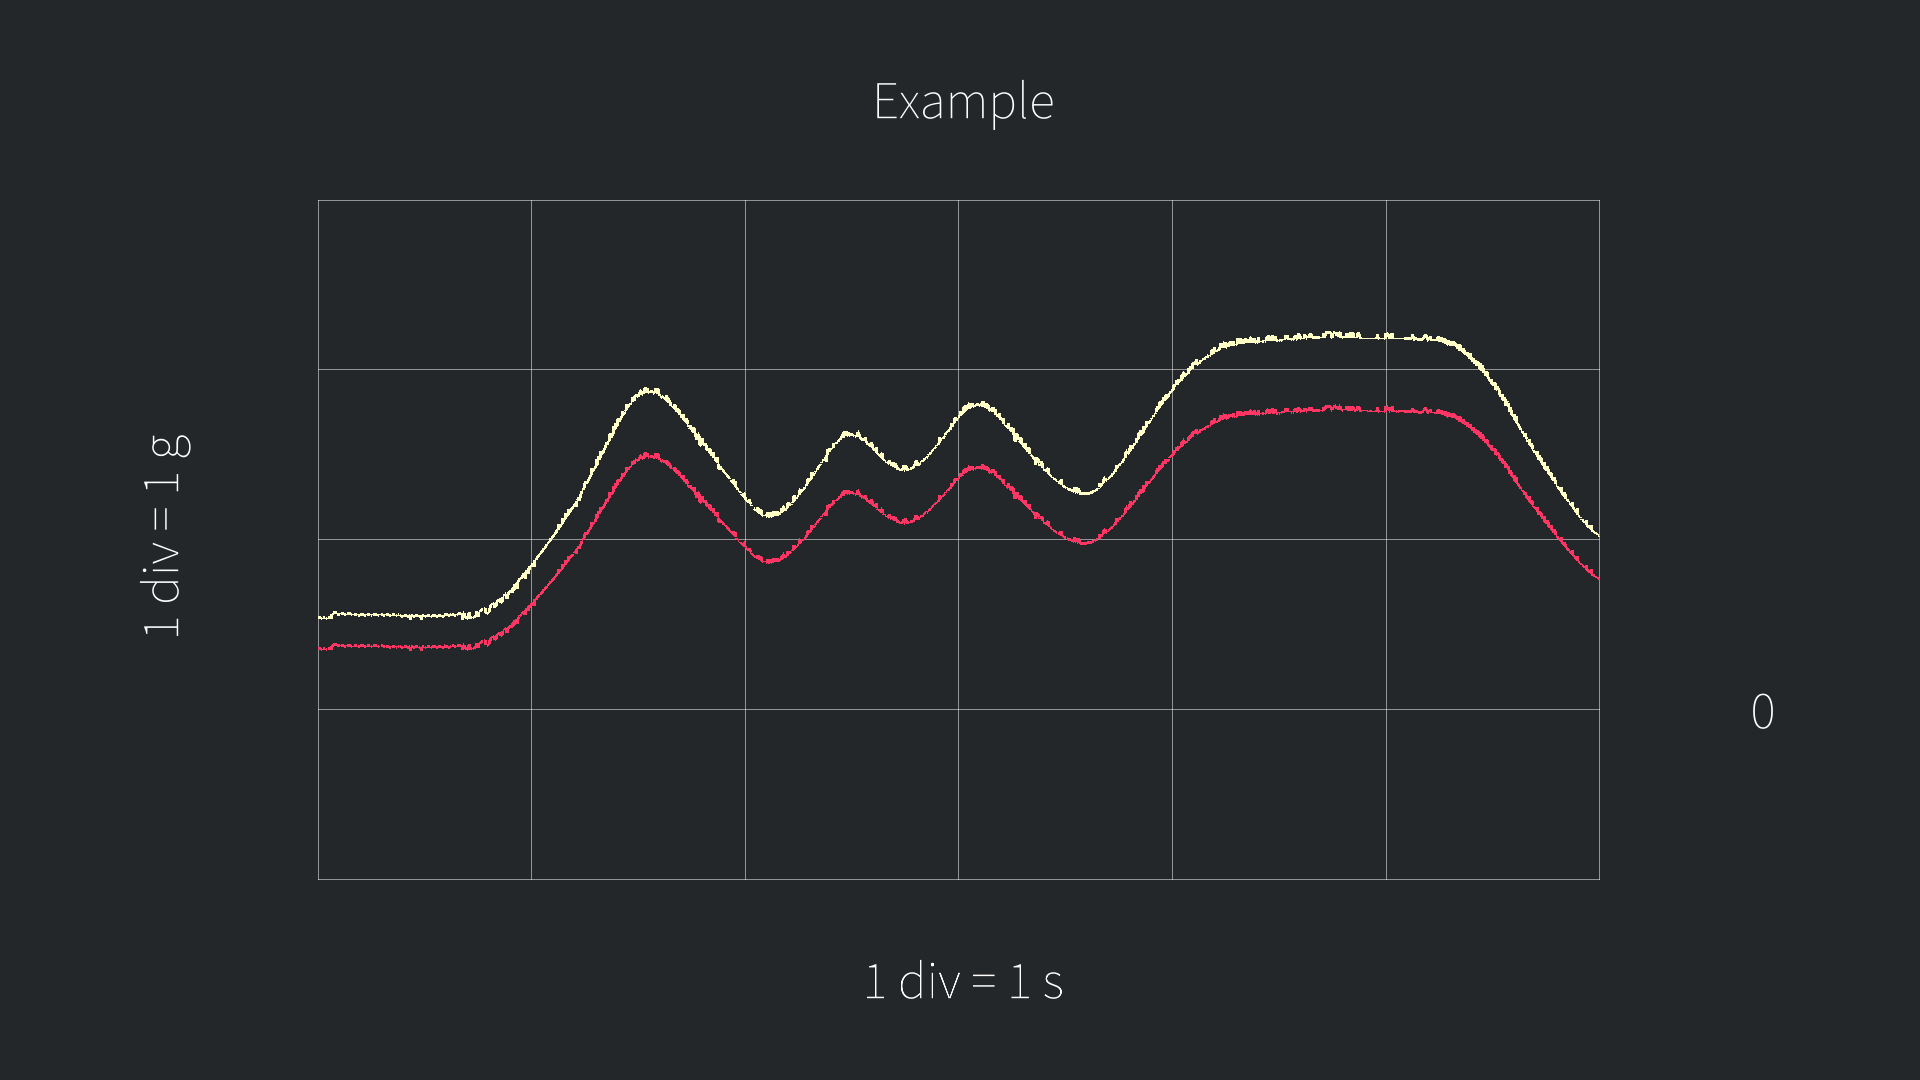 |
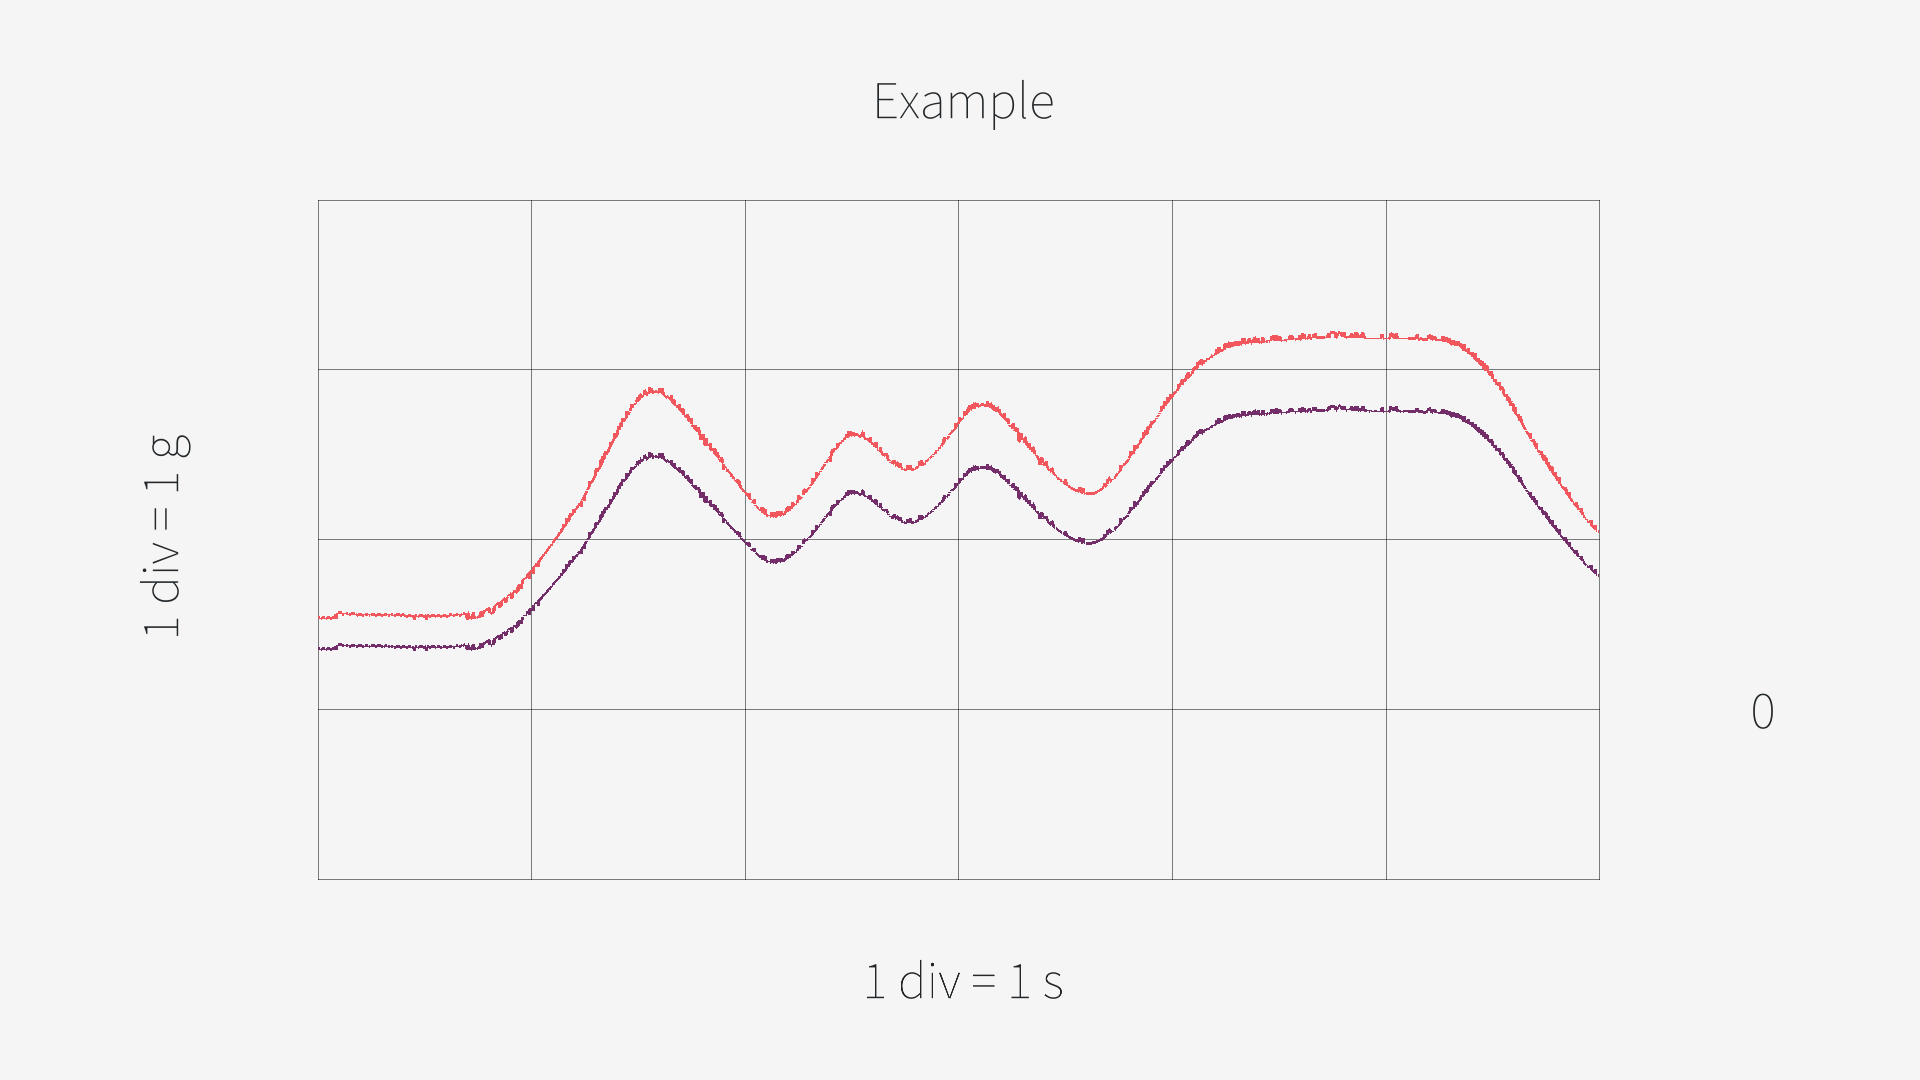 |
| Constant function | Linear function | Quadratic function |
|---|---|---|
 |
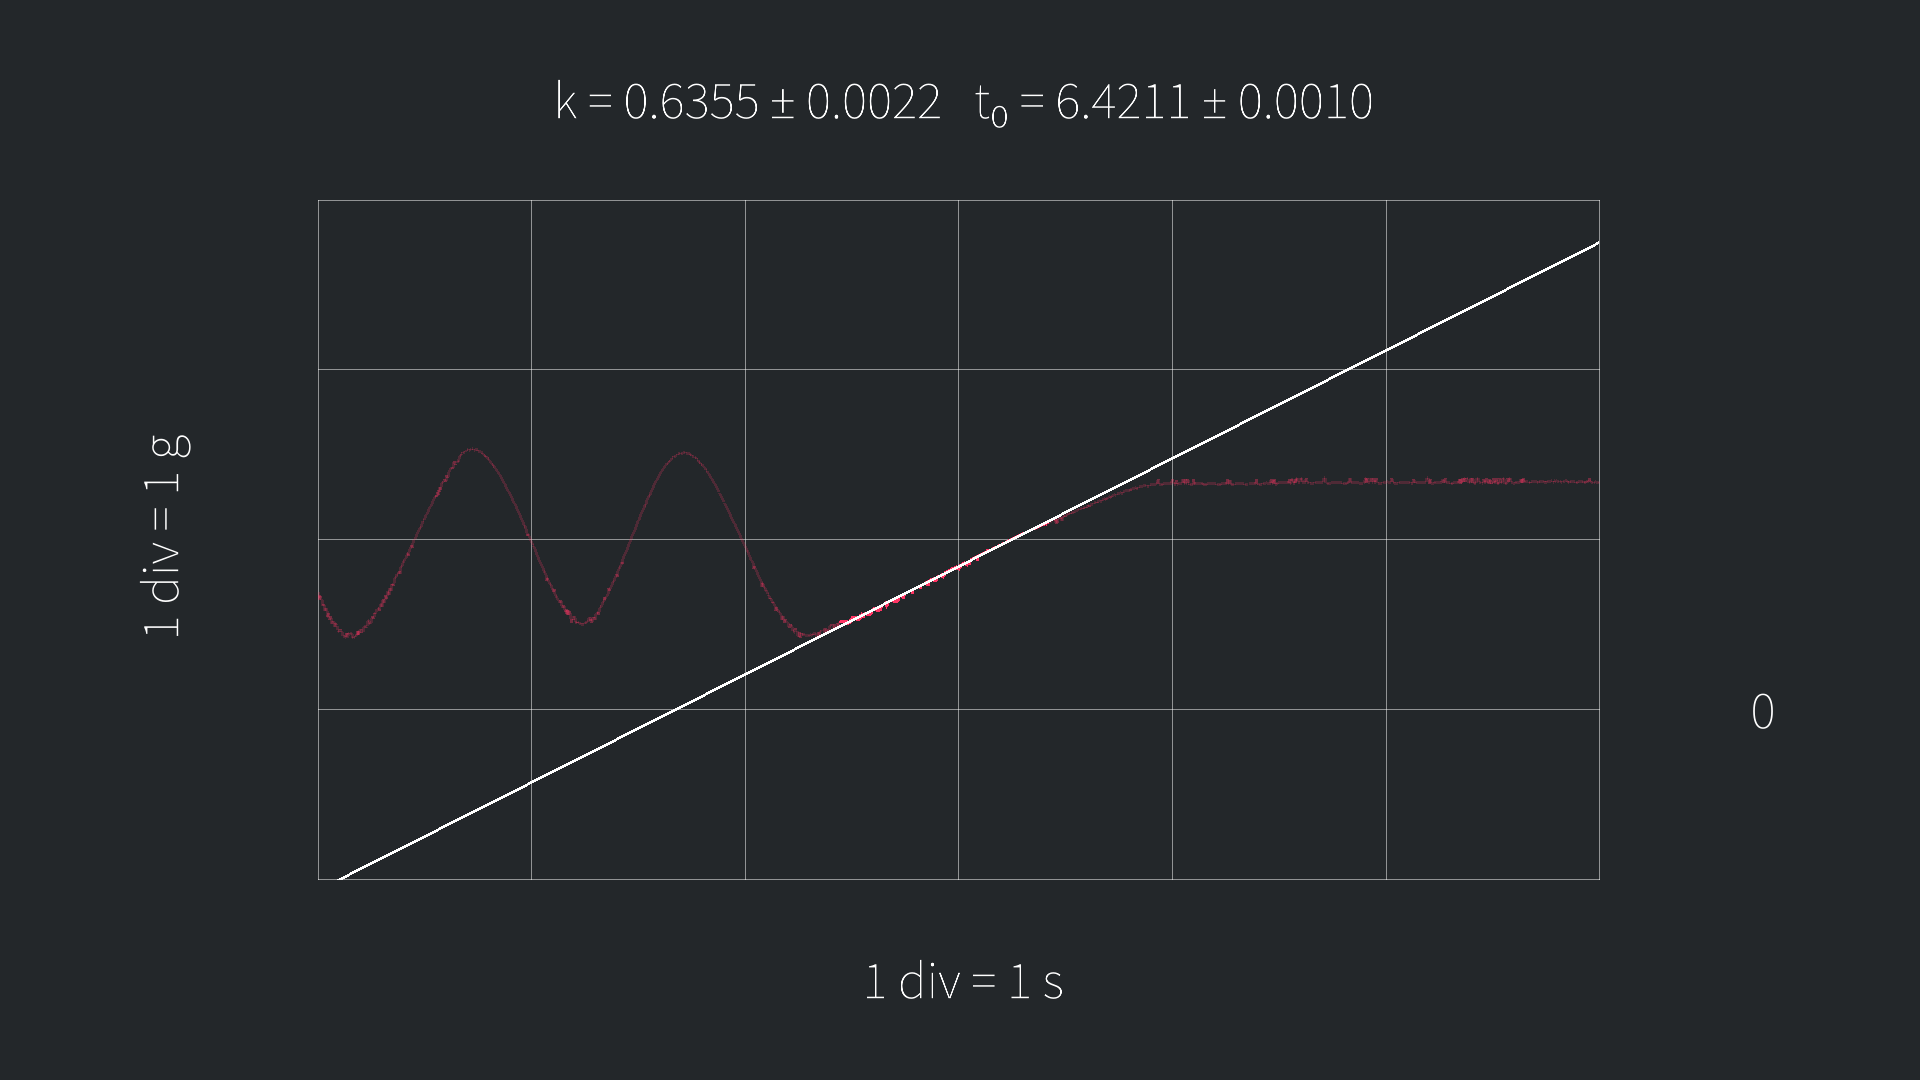 |
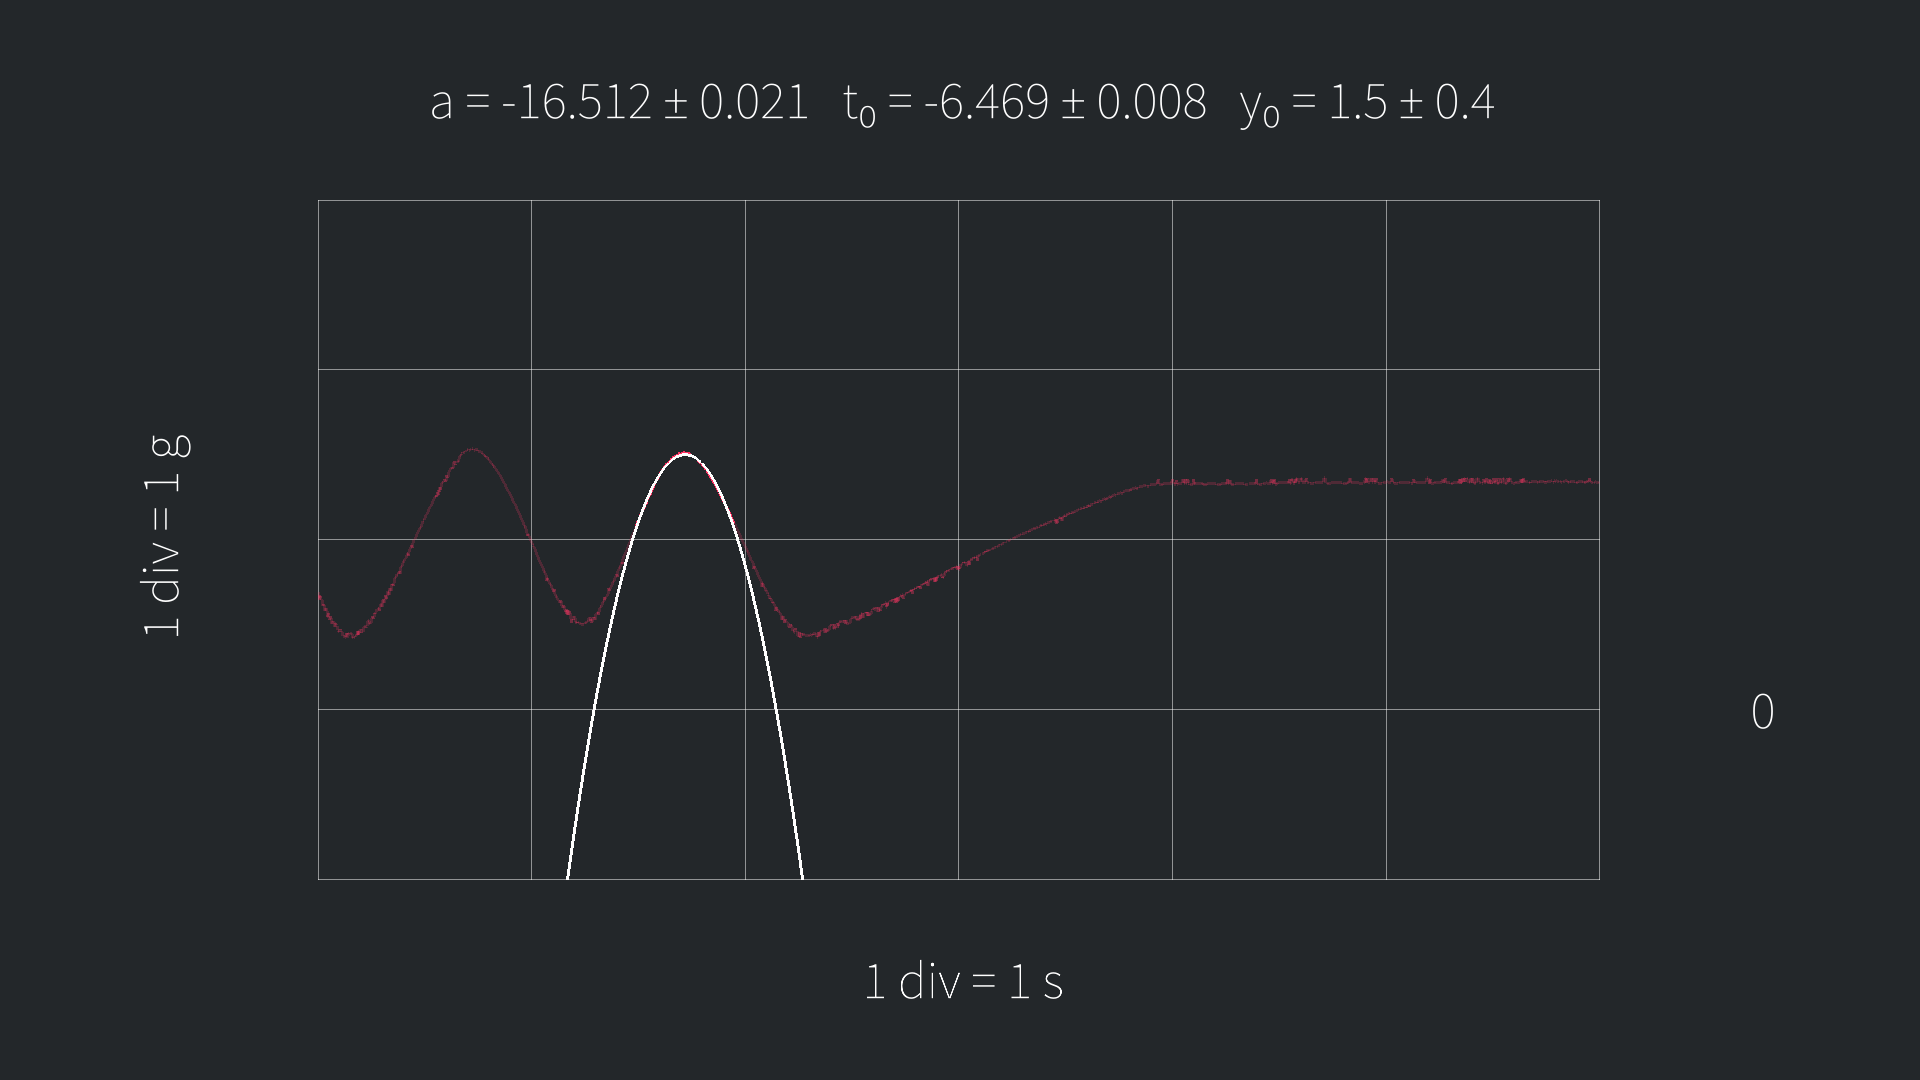 |
Note that the coefficients given in the approximations of the linear and the quadratic function aren't the canonical coefficients.
Specifically, the linear function is defined as:
y = k(t - t_0)
While the quadratic function is defined as:
y = a/2(t - t_0)^2 - y_0