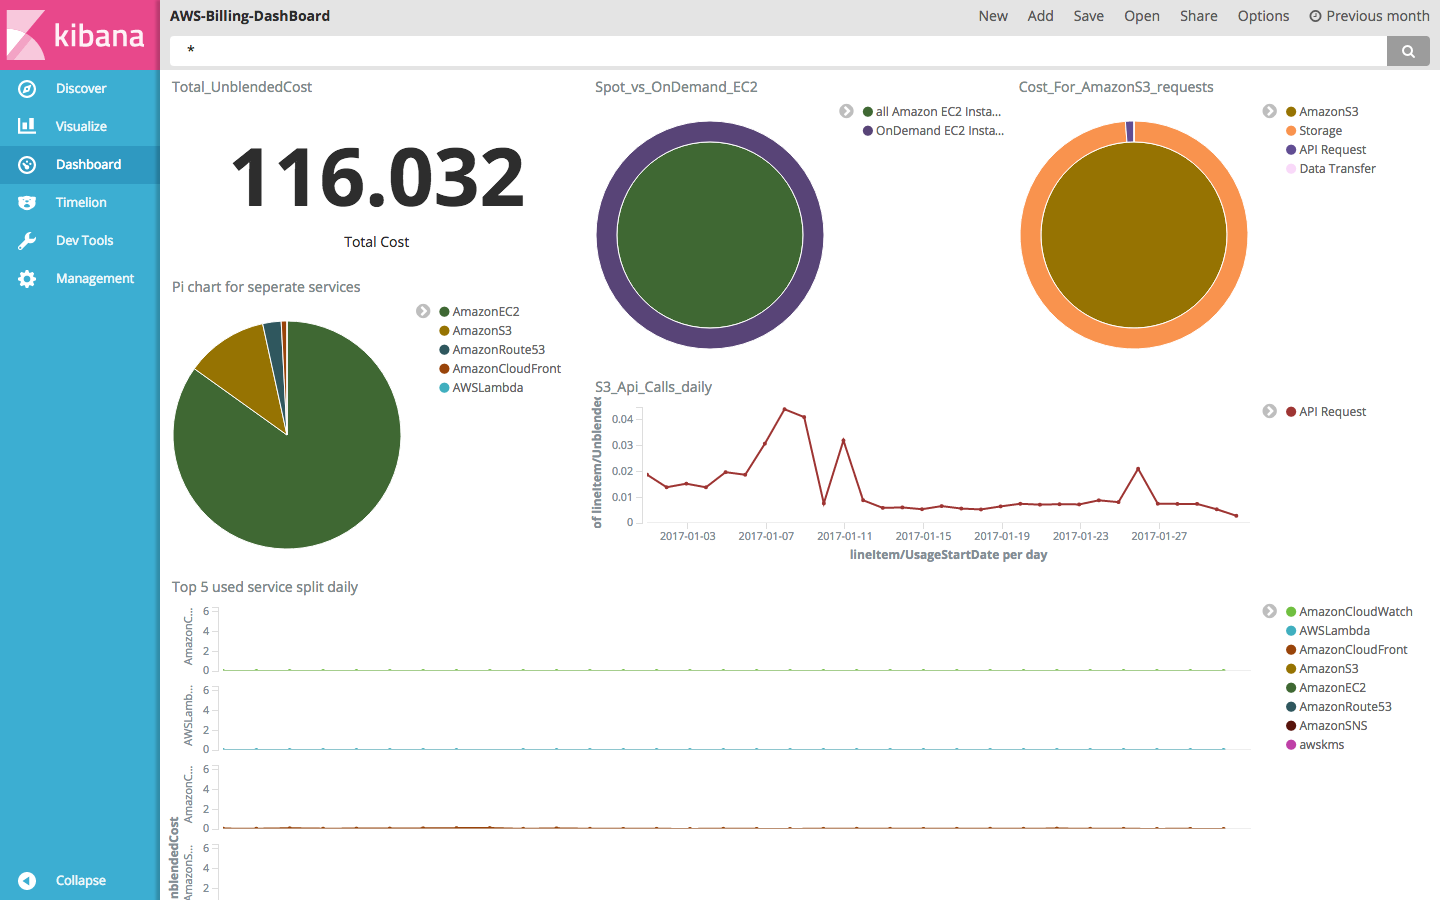
aws-elk-billing is a combination of configuration snippets and tools to assist with indexing AWS programatic billing access files(CSV's) and visualizing the data using Kibana.
Currently it supports AWS Cost and Usage Report type, although it might work for other AWS Billing Report Types which contains some extra columns along with all the columns from AWS Cost and Usage Report.
You can create AWS Cost and Usage Report at https://console.aws.amazon.com/billing/home#/reports
or follow instructions at http://docs.aws.amazon.com/awsaccountbilling/latest/aboutv2/detailed-billing-reports.html#turnonreports
There are Four Docker containers.
- Elasticsearch 2.3.3 (https://github.com/PriceBoardIn/elasticsearch/tree/2.3.3)
- Kibana (https://github.com/PriceBoardIn/kibana)
- Logstash (https://github.com/PriceBoardIn/logstash)
- aws-elk-billing (Refer: Dockerfile of this repository)
Integration among the 4 containers is done with docker-compose.yml
| Task | Files |
|---|---|
| Logstash configuration | logstash.conf |
| Kibana configuration | kibana.yml |
| Elasticsearch index mapping | aws-billing-es-template.json |
| Indexing Kibana dashboard | kibana/orchestrate_dashboard.sh |
| Indexing Kibana visualisation | kibana/orchestrate_visualisation.sh |
| Indexing Kibana default index (This file is just for reference purpose, we will automate this part eventually) | kibana/orchestrate_kibana.sh |
| Parsing the aws-billing CSV's and sending to logstash | main.go |
Connecting the dots: Wait for ELK Stack to start listening on their respective ports, downloads, extracts the latest compressed billing report from S3, XDELETE previous index of the current month, Index mapping, Index kibana_dashboard, Index kibana_visualization and finally executes main.go |
orchestrate.py |
| Integrating all 4 containers | Dockerfile, docker-compose.yml |
Clone the Repository and make sure that no process is listening to the ports used by all these dockers.
| Ports | Process |
|---|---|
| 9200, 9300 | Elasticsearch |
| 5160 | Kibana |
| 5140 | Logstash |
Rename prod.sample.env to prod.env and provide values for the following keys AWS_ACCESS_KEY_ID, AWS_SECRET_ACCESS_KEY, S3_BUCKET_NAME, S3_REPORT_PATH
prod.env is added in .gitignore so that you don't push your credentials upstream accidentally.

The entire process is automated through scripts and docker. All the components would be downloaded automatically inside your docker
-
sudo docker-compose up -d -
View
Kibanaat http://localhost:56012.1 Use the index pattern as
aws-billing-*and select the time field aslineItem/UsageStartDate2.2
Kibana AWS Billing Dashboardhttp://localhost:5601/app/kibana#/dashboard/AWS-Billing-DashBoard2.3 For MAC replace localhost with the ip of docker-machine To find IP of docker-machine
docker-machine ip default
3 . sudo docker-compose down to shutdown all the docker containers.
aws-elk-billingcontainer will take time while running the following two process[Filename: orchestrate.py].- Downloading and extracting AWS Billing report from AWS S3.
- Depending on the size of AWS Billing CSV report
main.gowill take time to index all the data to Elasticsearch via Logstash.
- You can view the dashboard in kibana, even while
main.gois still indexing the data. - In order to index new data, you'll have to run
docker-compose up -dagain.
