VarGen is an R package designed to get a list of variants related to a disease. It just need an OMIM morbid ID as input and optionally a list of tissues / gwas traits of interest to complete the results. You can use your own customised list of genes instead of an OMIM ID. VarGen is also capable of annotating the variants to help you rank and identify the most impactful ones.
All the coordinates are based on the hg38 version of the human genome.
VarGen is open-source and available on GitHub
Vargen was developed as part of the European Union’s Horizon 2020-funded project Nutrishield (GA 818110). For more information about the Nutrishield project, please visit the Nutrishield Webpage
Corentin Molitor, Matt Brember, Fady Mohareb, VarGen: An R package for disease-associated variant discovery and annotation, Bioinformatics, Early Online, btz930, https://doi.org/10.1093/bioinformatics/btz930
- VarGen
- How to Cite Vargen
- Table of Contents
- VarGen workflow
- Installation
- Preparing the input
- How to use VarGen
- Alternative pipelines
- Tips
- Some Examples
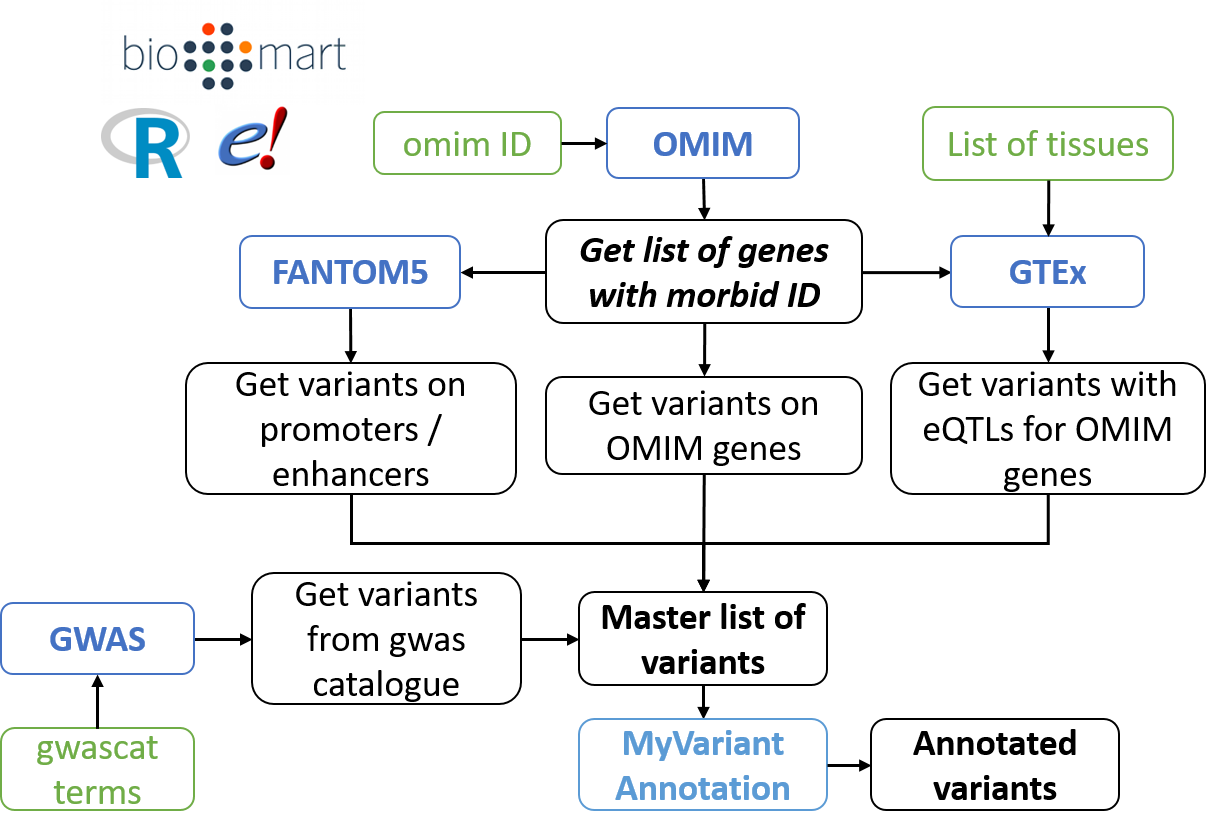
This pipeline is centred on the genes linked to the disease of interest in the Online Mendelian Inheritance in Man (subsequently called the "OMIM genes"). VarGen is designed as a discovery tool, if you want a more specific pipeline see "VarPhen" in "Alternative pipelines".
VarGen outputs variants from the following sources:
- OMIM: Variants located directly on the "OMIM genes".
- FANTOM5: Variants located on the enhancers / promoters of the "OMIM genes".
- GTEx: Variants associated with a change in expression for the "OMIM genes", in certain tissues. Currently GTEx v7 and v8 are supported.
- GWAS catalog: Variants associated with the phenotype of interest.
The variants are then annotated with myvariant.
VarGen needs the following:
- R (tested on version 3.6)
- An internet connection
- The following R libraries: (The number is the version tested during development)
    Bioconductor (3.9)      biomaRt (2.40.3)        gtools (3.8.1)
    gwascat (2.16.0)        jsonlite (1.6)          GenomeInfoDb (1.20.0)
    IRanges (2.18.1)        httr (1.4.1)            BiocGenerics (0.30.0)
    stringr (1.4.0)         utils (3.6.0)           splitstackshape (1.4.8)
    ggplot2 (3.2.1)         rtracklayer (1.44.2)    BiocManager (1.30.4)
    R.utils (2.9.0)         myvariant (1.14.0)      GenomicRanges (1.36.0)
    data.table (1.12.8)
- Optional R libraries (needed for the visualisation functions: vargen_visualisation and plot_manhattan_gwas):
Gviz (1.28.1) ggbio (>= 1.32.0)
To install the dependencies you can use the following command in R (it might take a while depending on your connection):
# If not already installed
install.packages("BiocManager")

BiocManager::install(c("biomaRt", "gtools", "GenomicRanges", "gwascat", "jsonlite",
                       "GenomeInfoDb", "IRanges", "httr", "BiocGenerics", "stringr",
                       "utils", "splitstackshape", "ggplot2", "rtracklayer",
                       "R.utils", "myvariant", "data.table"), dependencies = TRUE)
note: "R.methodsS3" and "R.oo" will be installed as dependencies of "R.utils"
The easiest way to get VarGen is to install it directly from R using “devtools”:
install.packages("devtools")
library(devtools)
install_github(repo = "MCorentin/vargen", dependencies = TRUE)
library(vargen)
Alternatively you can clone the GitHub repository:
git clone https://github.com/MCorentin/vargen
Then open R and install the package script from source:
library(utils)
install.packages("./vargen/", repos = NULL, type = "source")
VarGen is fetching data from public databases, it needs the following files (they should all be in the same folder). The easiest way to get them is to use the vargen_install function from this package. The list of files obtained by the function is available below (with their approximate sizes and the links to download them manually). note: The installation can take a while, especially for the GTEx files.
vargen_install(install_dir = "./vargen_data", gtex_version = "v8", verbose = T)
Alternatively, they can be installed manually (the approximate size of every file is written in parenthesis next to the filename):
-
enhancer_tss_associations.bed (~10 Mb), this is the enhancer to transcript start site association file from FANTOM5. (available at: http://enhancer.binf.ku.dk/presets/enhancer_tss_associations.bed)
-
hg19ToHg38.over.chain (~500 kb), some databases are still using information from the human reference genome "hg19". VarGen will use this file to liftover the information to "hg38" (available at: http://hgdownload.cse.ucsc.edu/goldenPath/hg19/liftOver/hg19ToHg38.over.chain.gz)
-
GTEx_Analysis_v8_eQTL (~1.45 Gb), a folder containing the significant variant gene pairs from the Genotype-Tissues Expression database (GTEx) (available at: https://gtexportal.org/home/datasets). v7 and v8 are supported by VarGen.
Direct link for v7: https://storage.googleapis.com/gtex_analysis_v7/single_tissue_eqtl_data/GTEx_Analysis_v7_eQTL.tar.gz
Direct link for v8: https://storage.googleapis.com/gtex_analysis_v8/single_tissue_qtl_data/GTEx_Analysis_v8_eQTL.tar
-
GTEx_Analysis_2017-06-05_v8_WholeGenomeSeq_838Indiv_Analysis_Freeze.lookup_table.txt.gz (~800 Mb), this is a lookup table between GTEx ids and rsids. Contains GTEx ids for v7 and v8.
-
gwas catalog file (~90 Mb), this is an optional file. Depending on your connection, creating the lastest gwas catalog using makeCurrentGwascat function can take a long time. You can instead download a gwas catalog file from http://www.ebi.ac.uk/gwas/api/search/downloads/alternative and give it as input for the VarGen pipeline.
note: VarGen will use the name of the file to get the extract date, so it needs to be in the format: [filename]_rYYYYY-MM-DD.tsv
The OMIM morbid ID is the starting point of the pipeline, from it VarGen will get the genes associated to the disease. You can obtain it from the OMIM website https://omim.org/ or using the list_omim_accessions function. In our case we will use “obesity leanness included” (OMIM id: 601665).
gene_mart <- connect_to_gene_ensembl()
View(list_omim_accessions(gene_mart))

# You can search using list of keywords as well:
list_omim_accessions(gene_mart, c("alzheimer", "neurodegeneration"))

#>      mim_morbid_accession    mim_morbid_description
#> [1]  606889                  ALZHEIMER DISEASE 4;;AD4;;ALZHEIMER DISEASE, FAMILIAL, 4
#> [2]  618476                  BRAIN ABNORMALITIES, NEURODEGENERATION, AND DYSOSTEOSCLEROSIS;BANDDOS
#> [3]  615643                  NEURODEGENERATION WITH BRAIN IRON ACCUMULATION 6; NBIA6
#> [4]  618276                  NEURODEGENERATION, CHILDHOOD-ONSET, WITH CEREBELLAR ATROPHY; CONDCA
#> [5]  618278                  FIBROSIS, NEURODEGENERATION, AND CEREBRAL ANGIOMATOSIS; FINCA
#> ...
This database will be used to get tissue-specific variants that are affecting the expression of the genes related to the disease. You can obtain the list of files with the list_gtex_tissues function.
list_gtex_tissues(gtex_dir = "./vargen_data/GTEx_Analysis_v8_eQTL/")

#>      keywords                     filepaths
#> [1]  Adipose_Subcutaneous         vargen_data/GTEx_Analysis_v8_eQTL/Adipose_Subcutaneous.v8.signif_variant_gene_pairs.txt.gz
#> [2]  Adipose_Visceral_Omentum     vargen_data/GTEx_Analysis_v8_eQTL/Adipose_Visceral_Omentum.v8.signif_variant_gene_pairs.txt.gz
#> [3]  Adrenal_Gland                vargen_data/GTEx_Analysis_v8_eQTL/Adrenal_Gland.v8.signif_variant_gene_pairs.txt.gz
#> [4]  Artery_Aorta                 vargen_data/GTEx_Analysis_v8_eQTL/Artery_Aorta.v8.signif_variant_gene_pairs.txt.gz
#> ...
To select the GTEx tissues of interest you can use the select_gtex_tissues function, for our case we will use the adipose tissues (subcutaneous and visceral):
adipose_tissues <- select_gtex_tissues("./vargen_data/GTEx_Analysis_v8_eQTL/", "adipose")
adipose_tissues

#> [1] "./vargen_data/GTEx_Analysis_v8_eQTL/Adipose_Subcutaneous.v8.signif_variant_gene_pairs.txt.gz"
#> [2] "./vargen_data/GTEx_Analysis_v8_eQTL/Adipose_Visceral_Omentum.v8.signif_variant_gene_pairs.txt.gz"
The gwas traits will be used to get associated variants in the gwas catalog (https://www.ebi.ac.uk/gwas/). You can search the available gwas traits by keyword with the list_gwas_traits function. Here we are going to use a local gwas catalog file.
gwas_cat <- create_gwas("./vargen_data")
obesity_traits <- list_gwas_traits("obesity", gwas_cat)
obesity_traits

#>  [1] "Obesity (extreme)"
#>  [2] "Obesity-related traits"
#>  [3] "Obesity"
#>  [4] "Obesity (early onset extreme)"
#>  [5] "Obesity in adult survivors of childhood cancer exposed to cranial radiation"
#>  [6] "Obesity in adult survivors of childhood cancer not exposed to cranial radiation"
#>  [7] "Bilirubin levels in extreme obesity"
#>  [8] "Type 2 diabetes (young onset) and obesity"
#>  [9] "Obesity and osteoporosis"
#> [10] "Hepatic lipid content in extreme obesity"
#> [11] "Hyperinsulinemia in obesity"
VarGen main entry point is the vargen_pipeline function.
The mandatory inputs are:
- The folder with the installed files, "./vargen_data/" in our case (see "Obtaining the local files")
- A OMIM morbid id, “601665” in our case (see "Getting the OMIM id").
- An output directory, where information about the variants and the genes will be written. The default is the current directory “./”.
The optional inputs are:
- A fantom5 correlation threshold, the higher it is, the stricter you are about association between genes and enhancers. The default is 0.25
- A list of GTEx tissues (see "Getting the GTEx tissues")
- A list of gwas traits (see "Getting the gwas traits")
Now we can launch the pipeline with all the input data:
adipose_tissues <- select_gtex_tissues("./vargen_data/GTEx_Analysis_v8_eQTL/",
                                       "adipose")

gwas_cat <- create_gwas("./vargen_data")
obesity_traits <- list_gwas_traits("obesity", gwas_cat)

obesity_variants <- vargen_pipeline(vargen_dir = "./vargen_data/",
                                    omim_morbid_ids = "601665",
                                    gtex_tissues = adipose_tissues,
                                    gwas_traits = obesity_traits,
                                    verbose = T)
You will obtain a data.frame with the list of variants, their position on GRCh38, the ensembl id and hgnc gene symbol of the gene associated with the variant and the source (omim, fantom5, gtex or gwas). For gtex, the name of the tissue from which the variant was found is written in parenthesis, for example: "gtex (Adipose_Subcutaneous)"
#  chr     pos         rsid           ensembl_gene_id    hgnc_symbol  source
#> chr2    25160855    rs777983882    ENSG00000115138    POMC         omim
#> chr2    25160866    rs1480805741   ENSG00000115138    POMC         omim
#> chr2    25160871    rs1245939527   ENSG00000115138    POMC         omim
#> chr2    25160872    rs1219237056   ENSG00000115138    POMC         omim
#> chr2    25160877    rs1453226041   ENSG00000115138    POMC         omim
#> chr2    25160879    rs566456581    ENSG00000115138    POMC         omim
...
#> chr5    96442329    rs6879048      ENSG00000175426    PCSK1        gtex (Adipose_Visceral_Omentum)
This pipeline is designed as a discovery analysis, to identify potential new variants, you should not expect every variants from the pipeline to have an effect on the phenotype. Annotating the variants will help you defining which variants to keep or discard. To annotate the variants you can use the annotate_variants function with the list of rsids obtained with the vargen pipeline. This uses myvariant.info to annotate the variants and may take some time depending on your internet connection.
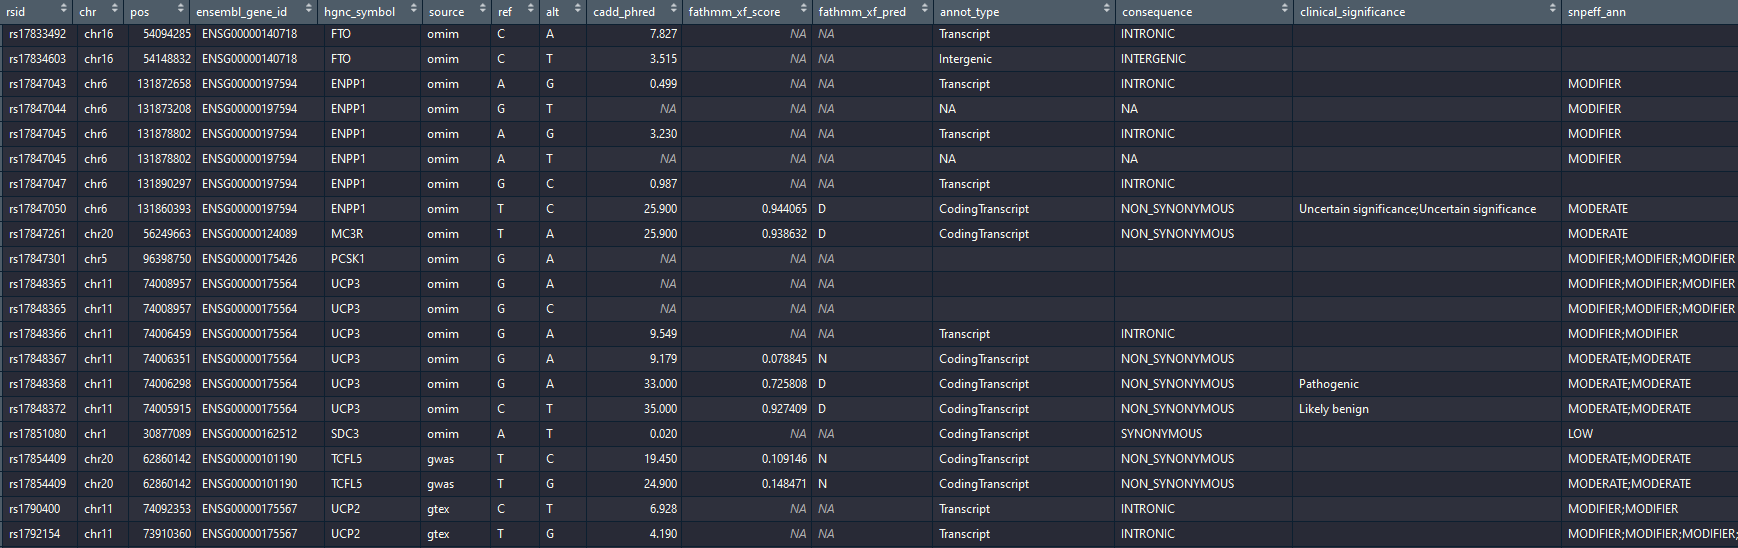
The annotation contains:
- ref: the reference allele in the human reference (GRCh38)
- alt: the alternative reference for this rsid. Some rsid are multi-allelic and can have more than one alternative allele. In this case VarGen creates one line per alternative allele and annotates them separately (as some alleles are more deleterious than others for a single rsid).
- CADD Phred score: ranging from 1 to 99, based on the rank of each variant relative to all possible 8.6 billion substitutions in the human reference genome. A higher value means a more deleterious variant. (above 10 means the variant is in the top 10%, above 20 in the top 1%).
- fathmm-xf score: between 0 and 1, a higher value means a more deleterious variant. (more confidence closer to 0 or 1)
- fathmm-xf prediction: "D" (DAMAGING) if score > 0.5 or "N" (NEUTRAL) otherwise.
- Annotation type: information about the variant location (eg: coding, non-coding, regulatory region...)
- Consequence: gives more information on the functional effect (eg: REGULATORY, DOWNSTREAM, STOP_GAINED, SPLICE-SITE...)
- ClinVar clinical significance: standard to report the clinical significance of certain variants (eg: "benign", "pathogenic", "drug response" etc....).
- snpEff impact: assessment of the putative impact of the variant (HIGH, MODERATE, MODIFIER or LOW).
/!\ The alternative allele is not always the risk allele (it can be the reference allele, meaning that the majority of the population is carrying the risk).
obesity_annotation <- annotate_variants(obesity_variants$rsid, verbose = T)

# Merging the output of the annotation with VarGen output, using the "rsid" column
obesity_ann <- merge(obesity_variants, obesity_annotation)

# We advise you to write the variants in a file, so you will not have to run the pipeline again.
write.table(x = obesity_ann, quote = FALSE, row.names = FALSE,
            file = "./OMIM_601665/vargen_variants_annotated.tsv", sep = "\t")
Output after annotation:
As VarGen is outputting a lot of variants, you may want to filter the results. The filtering strategy is dependent on your preferences. VarGen outputs an R data.frame containing information about each variant. You can focus on clinically significant variants ("pathogenic", "likely pathogenic" etc...), on variants with a high phred score etc...
You can even combine different filtering, for example we found that keeping all the variants from the gwas catalog and with clinical significance while removing the variants with a cadd phred score lower than 10 was removing a lot of potentially false positive results:
vargen_phred_10 <- obesity_ann [obesity_ann$cadd_phred > 10,]
vargen_phred_10 <- vargen_phred_10[!is.na(vargen_phred_10$cadd_phred),]

vargen_clinVar <- obesity_ann [obesity_ann$clinical_significance != "",]

vargen_gwas <- obesity_ann[obesity_ann$source == "gwas",]

#Concatenating the different filtering
obesity_filtered <- rbind(vargen_phred_10, vargen_clinVar, vargen_gwas)
A more specific, alternative pipeline is available as part of this package, called "VarPhen", it outputs a smaller list of variants, but directly related to the disease of interest. It relies on biomaRt to link variants to phenotypes.
note: You will need to specify the columns to merge the results from VarPhen ("redsnp_id") and the annotation ("rsid"). cf: the example below.
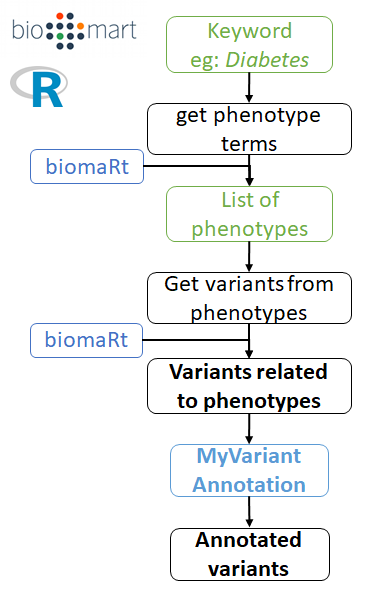
Example with obesity:
# First connect to snp ensembl
snp_mart <- connect_to_snp_ensembl()
obesity_phens <- get_phenotype_terms(keyword = "obesity",
snp_mart = snp_mart)
obesity_varphen <- get_variants_from_phenotypes(phenotypes = obesity_phens,
snp_mart = snp_mart)
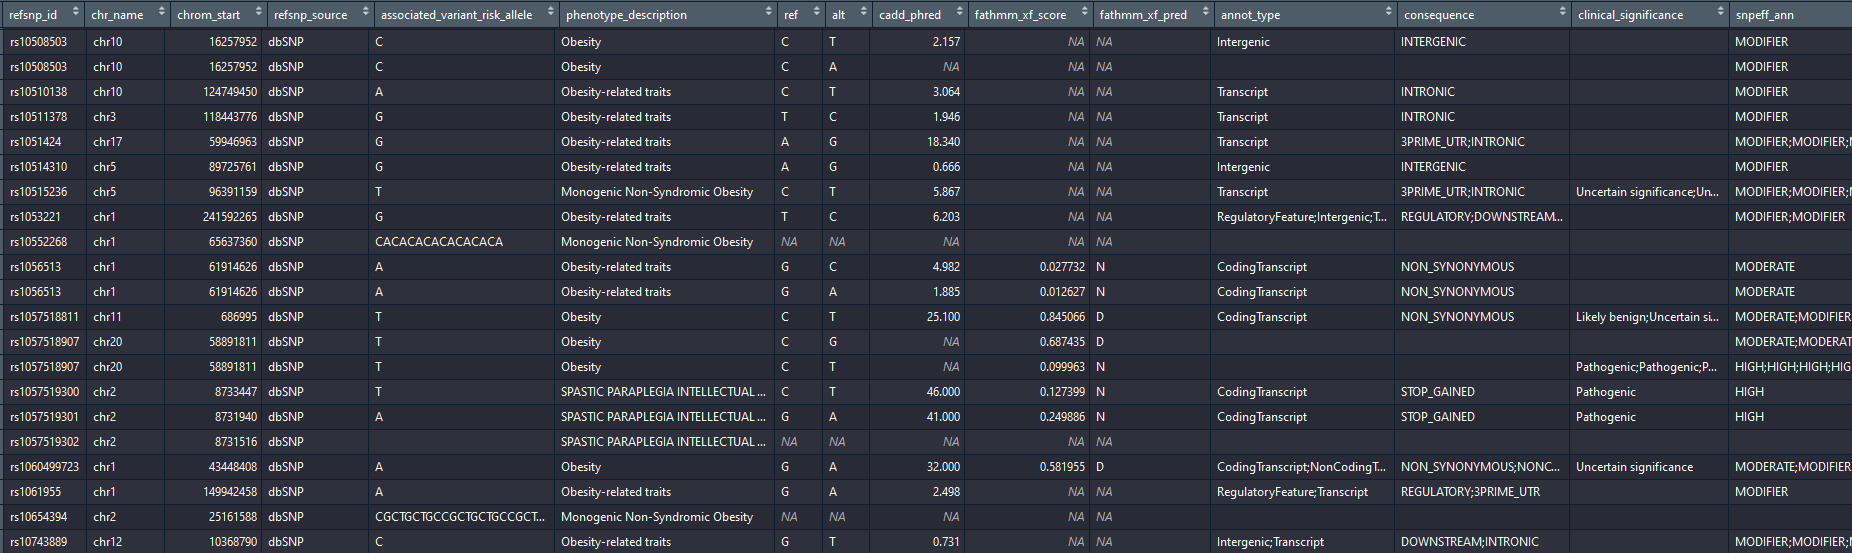
obesity_varphen_annotation <- annotate_variants(obesity_varphen$refsnp_id)
# /!\ contrary to vargen, here you need to specify which columns to merge
# "refsnp_id" for varphen, and "rsid" for the annotation.
obesity_varphen_annotated <- merge(obesity_varphen,
obesity_varphen_annotation,
by.x = "refsnp_id", by.y = "rsid")
Output example:
If instead of an OMIM id you are interested in a specific list of genes, you can use the vargen_custom function with a list of ensembl gene ids. This take the same input as vargen_pipeline (except the omim id) and follow the same workflow (variants on genes, promoters, gtex and gwas).
Example:
adipose_tissues <- select_gtex_tissues("./vargen_data/GTEx_Analysis_v8_eQTL/",
                                       "adipose")

gwas_cat <- create_gwas("./vargen_data")
obesity_traits <- list_gwas_traits("obesity", gwas_cat)

obesity_custom <- vargen_custom(vargen_dir = "./vargen_data/",
                                gene_ids = c("ENSG00000155846", "ENSG00000115138"),
                                outdir = "./",
                                gtex_tissues = adipose_tissues,
                                gwas_traits = obesity_traits,
                                verbose = T)
If you are only interested in the gwas variants, you can use the following commands:
gwas_cat <- create_gwas()

# This will list the gwas traits with "alzheimer":
list_gwas_traits(keywords = "alzheimer", gwas_cat = gwas_cat)

# Selecting some gwas traits of interest:
alzheimer_traits <- c("Alzheimer's disease", "Alzheimer's disease (late onset)", "Alzheimer's disease (cognitive decline)")

# This will get the variants from the selected traits:
gwas_variants <- get_gwas_variants(gwas_cat = gwas_cat, gwas_traits = alzheimer_traits)

# If you want more details about the variants you can annotate them:
gwas_variants_annotated <- annotate_variants(rsid = gwas_variants$rsid)
If you want to visualise the variants in a manhattan plot, you can use the plot_manhattan_gwas function:
gwas_cat <- create_gwas()

alzheimer_traits <- c("Alzheimer's disease", "Alzheimer's disease (late onset)", "Alzheimer's disease biomarkers",
                      "Alzheimer's disease (cognitive decline)")

plot_manhattan_gwas(traits = alzheimer_traits, gwas_cat = gwas_cat)

# Optional: if you want to save the plot as a pdf
pdf("./manhanttan_alzheimer.pdf", width = 14)
    plot_manhattan_gwas(traits = alzheimer_traits, gwas_cat = gwas_cat)
dev.off()
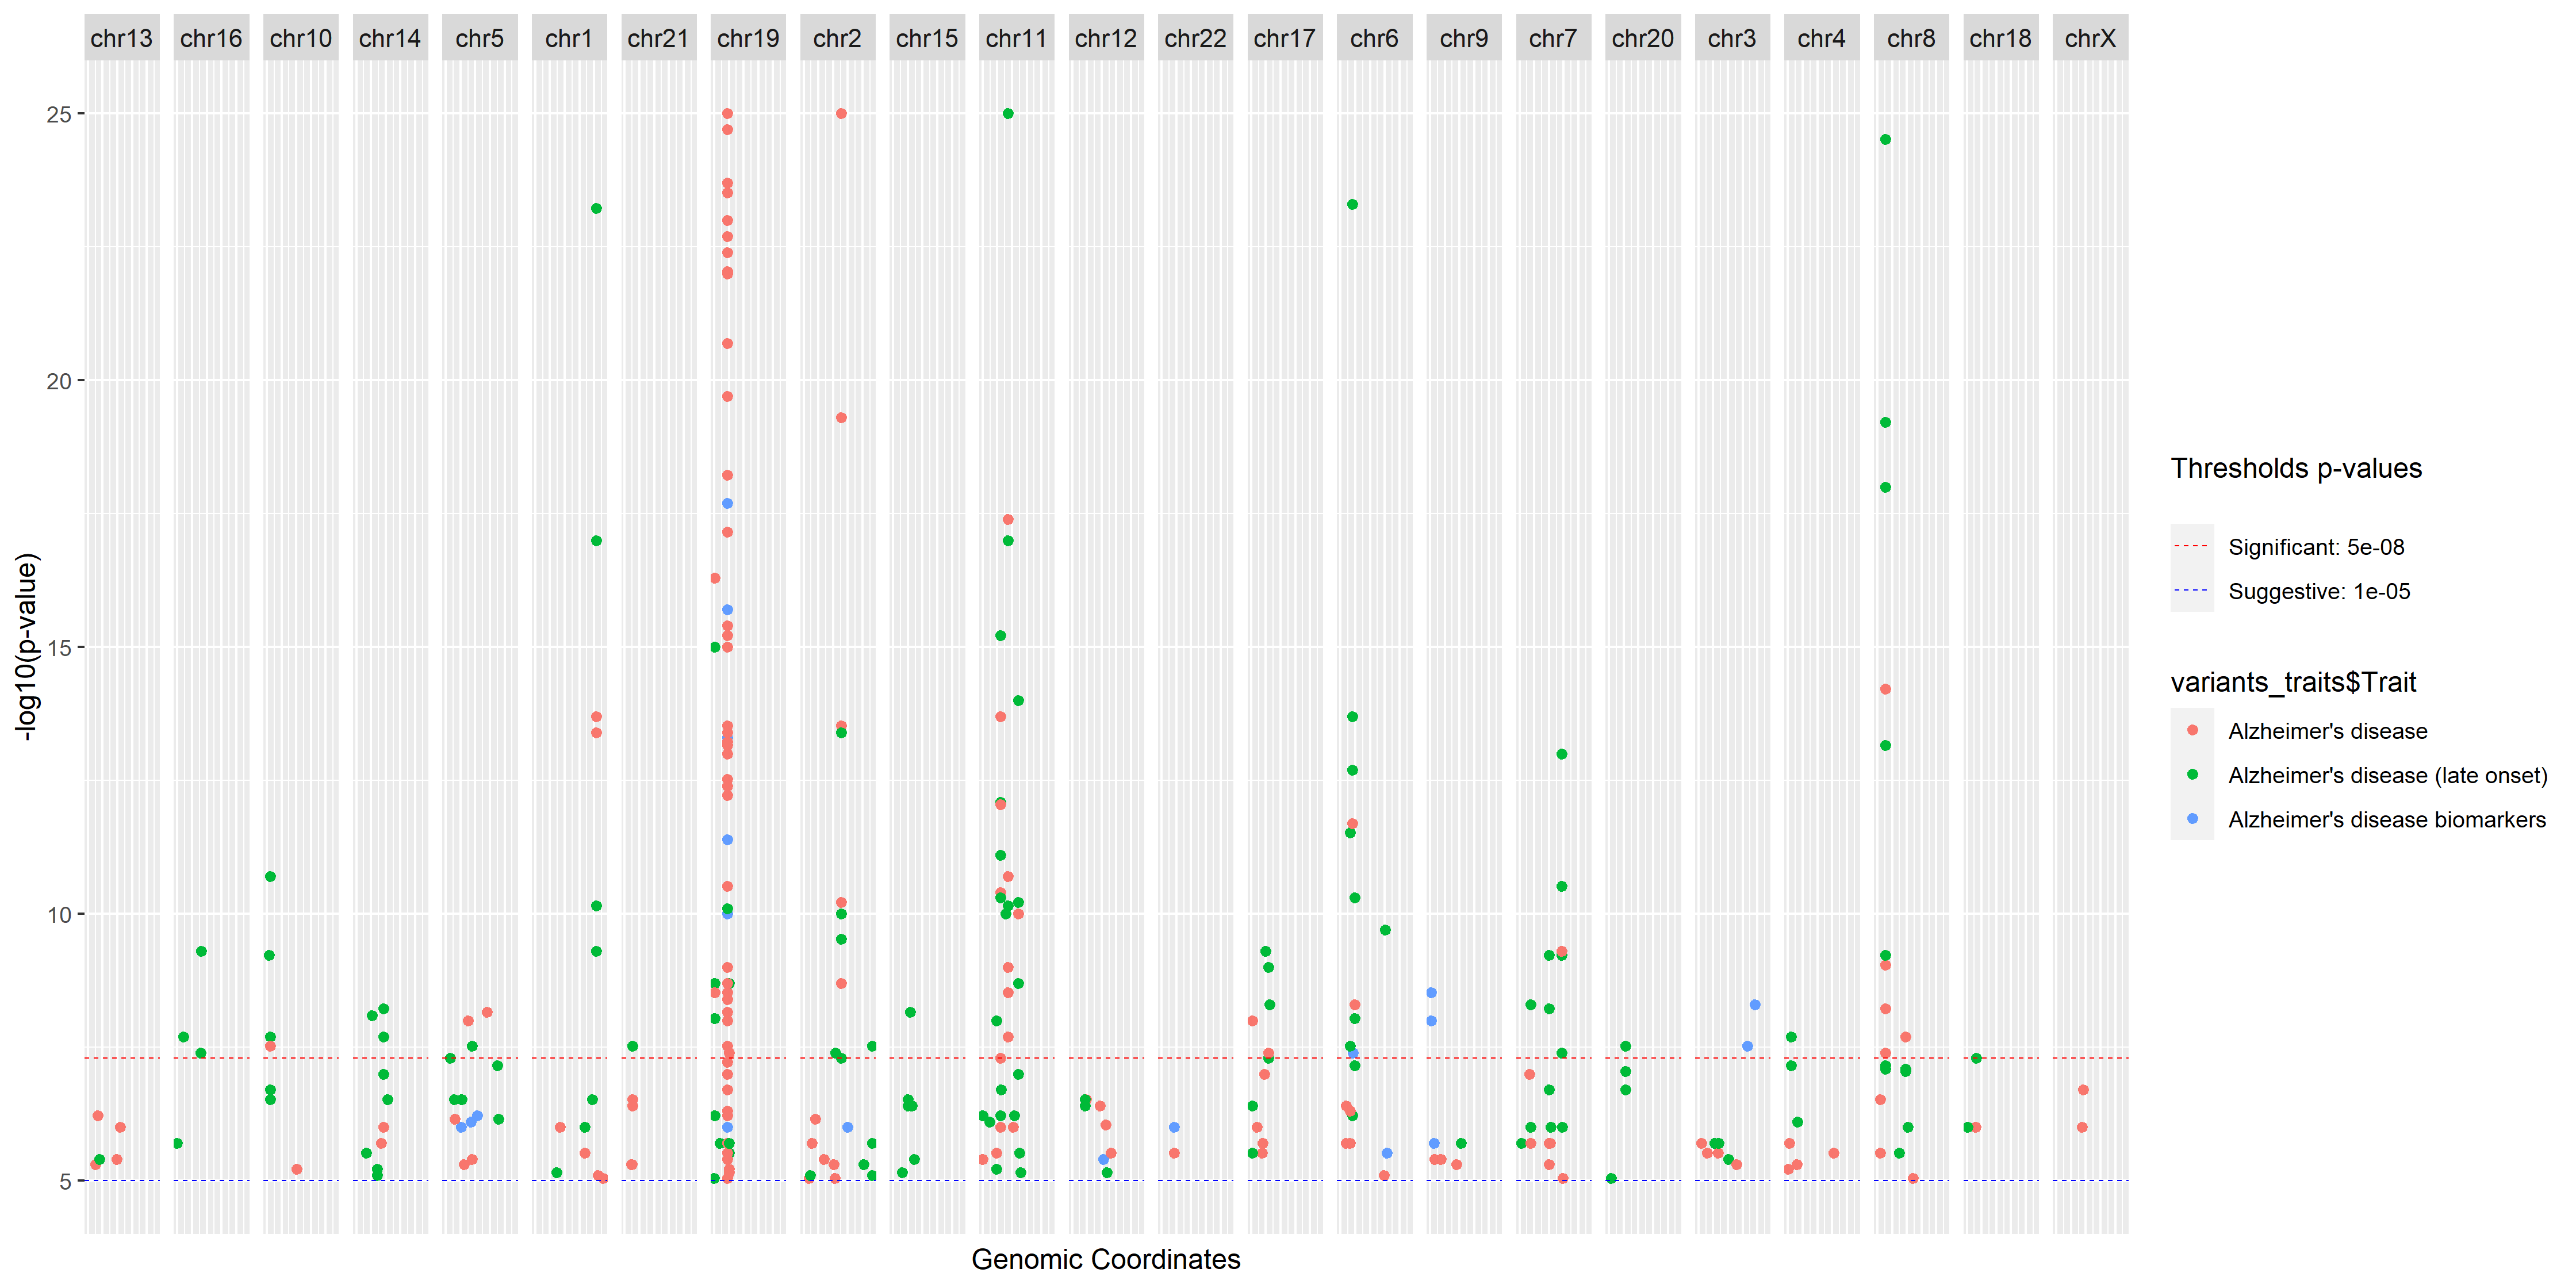
The two thresholds, suggestive and significant, correspond to the definition given by Lander and Kruglyak:
Lander E, Kruglyak L. Genetic dissection of complex traits: guidelines for interpreting and reporting linkage results. Nat Genet. 1995;11(3):241-7.
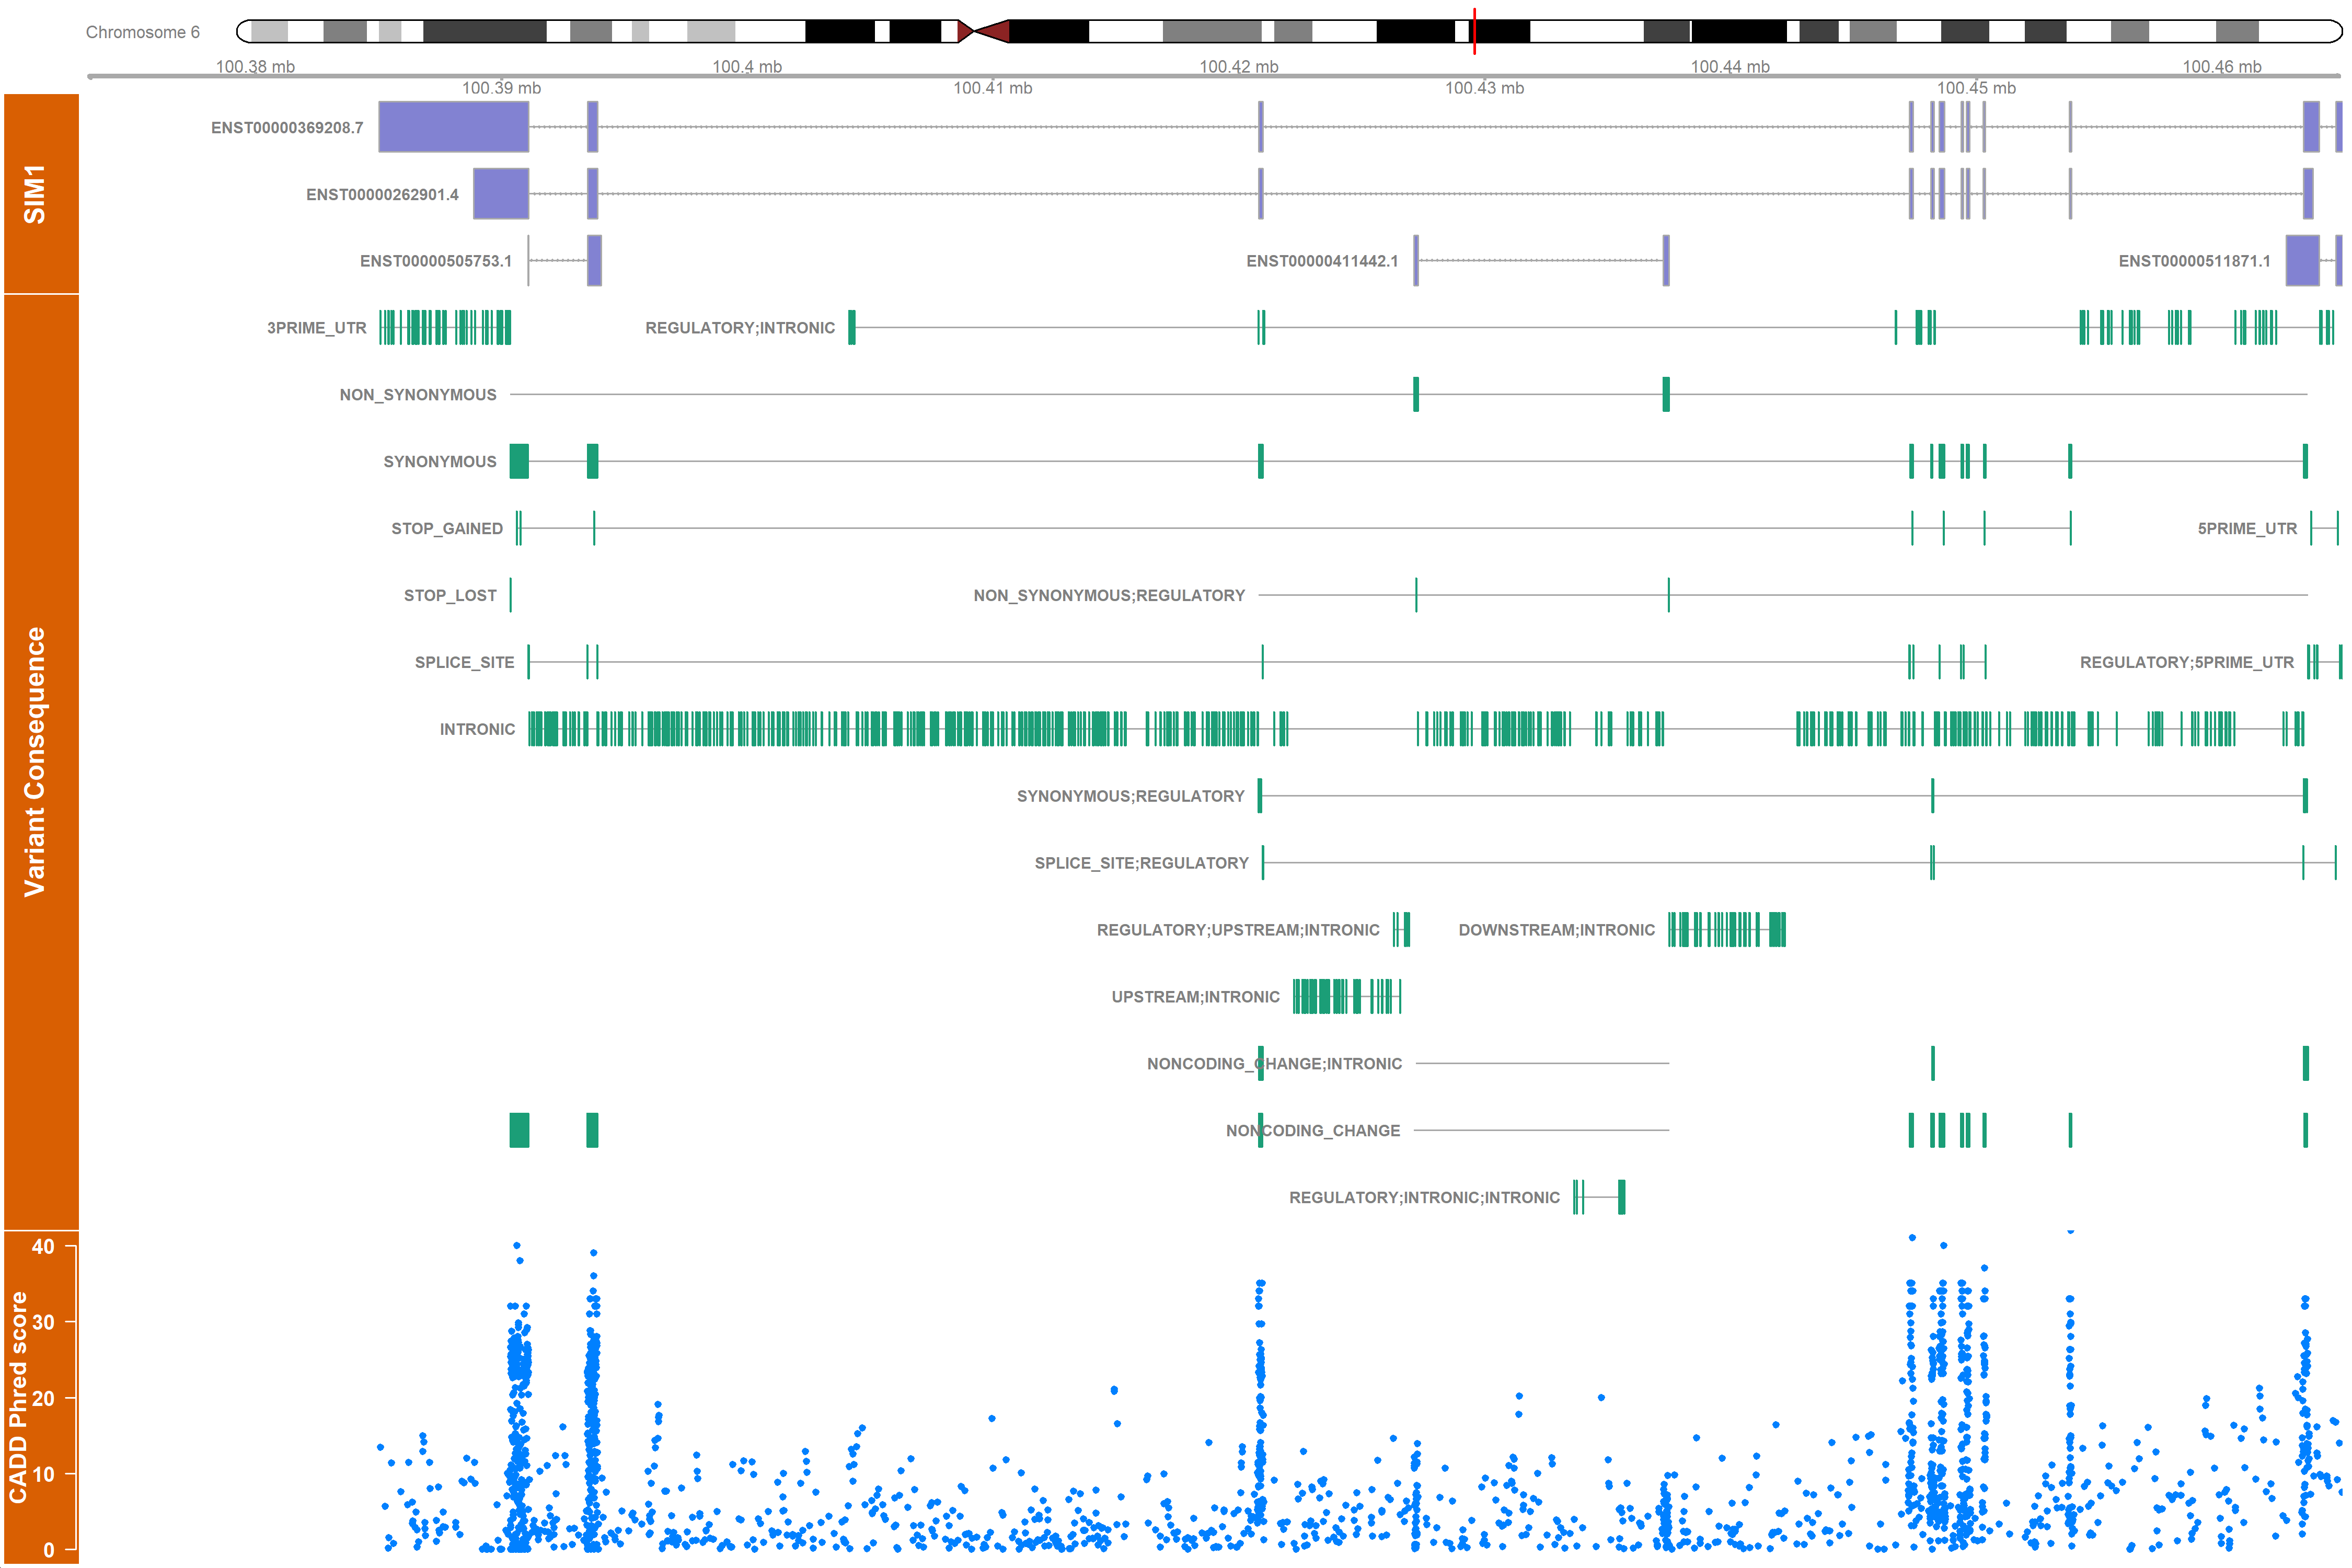
You can use the vargen_visualisation function to have an overview of the variants located on the omim genes. Note that one variant can be represented multiple times, as it consequence and phred score will be different according to each transcript.
# cf: 'Annotating the variants' to create "vargen_variants_annotated.tsv":
obesity_vargen_ann <- read.table(file = "./OMIM_601665/vargen_variants_annotated.tsv",
                                 header = T, sep = "\t", stringsAsFactors = F)

gene_mart <- connect_to_gene_ensembl()
vargen_visualisation(annotated_snps = obesity_vargen_ann,
                     outdir = "./obesity_gviz/",
                     device = "png",
                     gene_mart = gene_mart)
The plot contains 4 tracks:
- The chromosome, with a red marker on the gene location
- The ensembl transcripts
- The variant consequences, grouped by type (eg: INTRONIC, STOP LOST etc...), each green bar represent a variant
- The cadd phred score, each dot represent a variant.
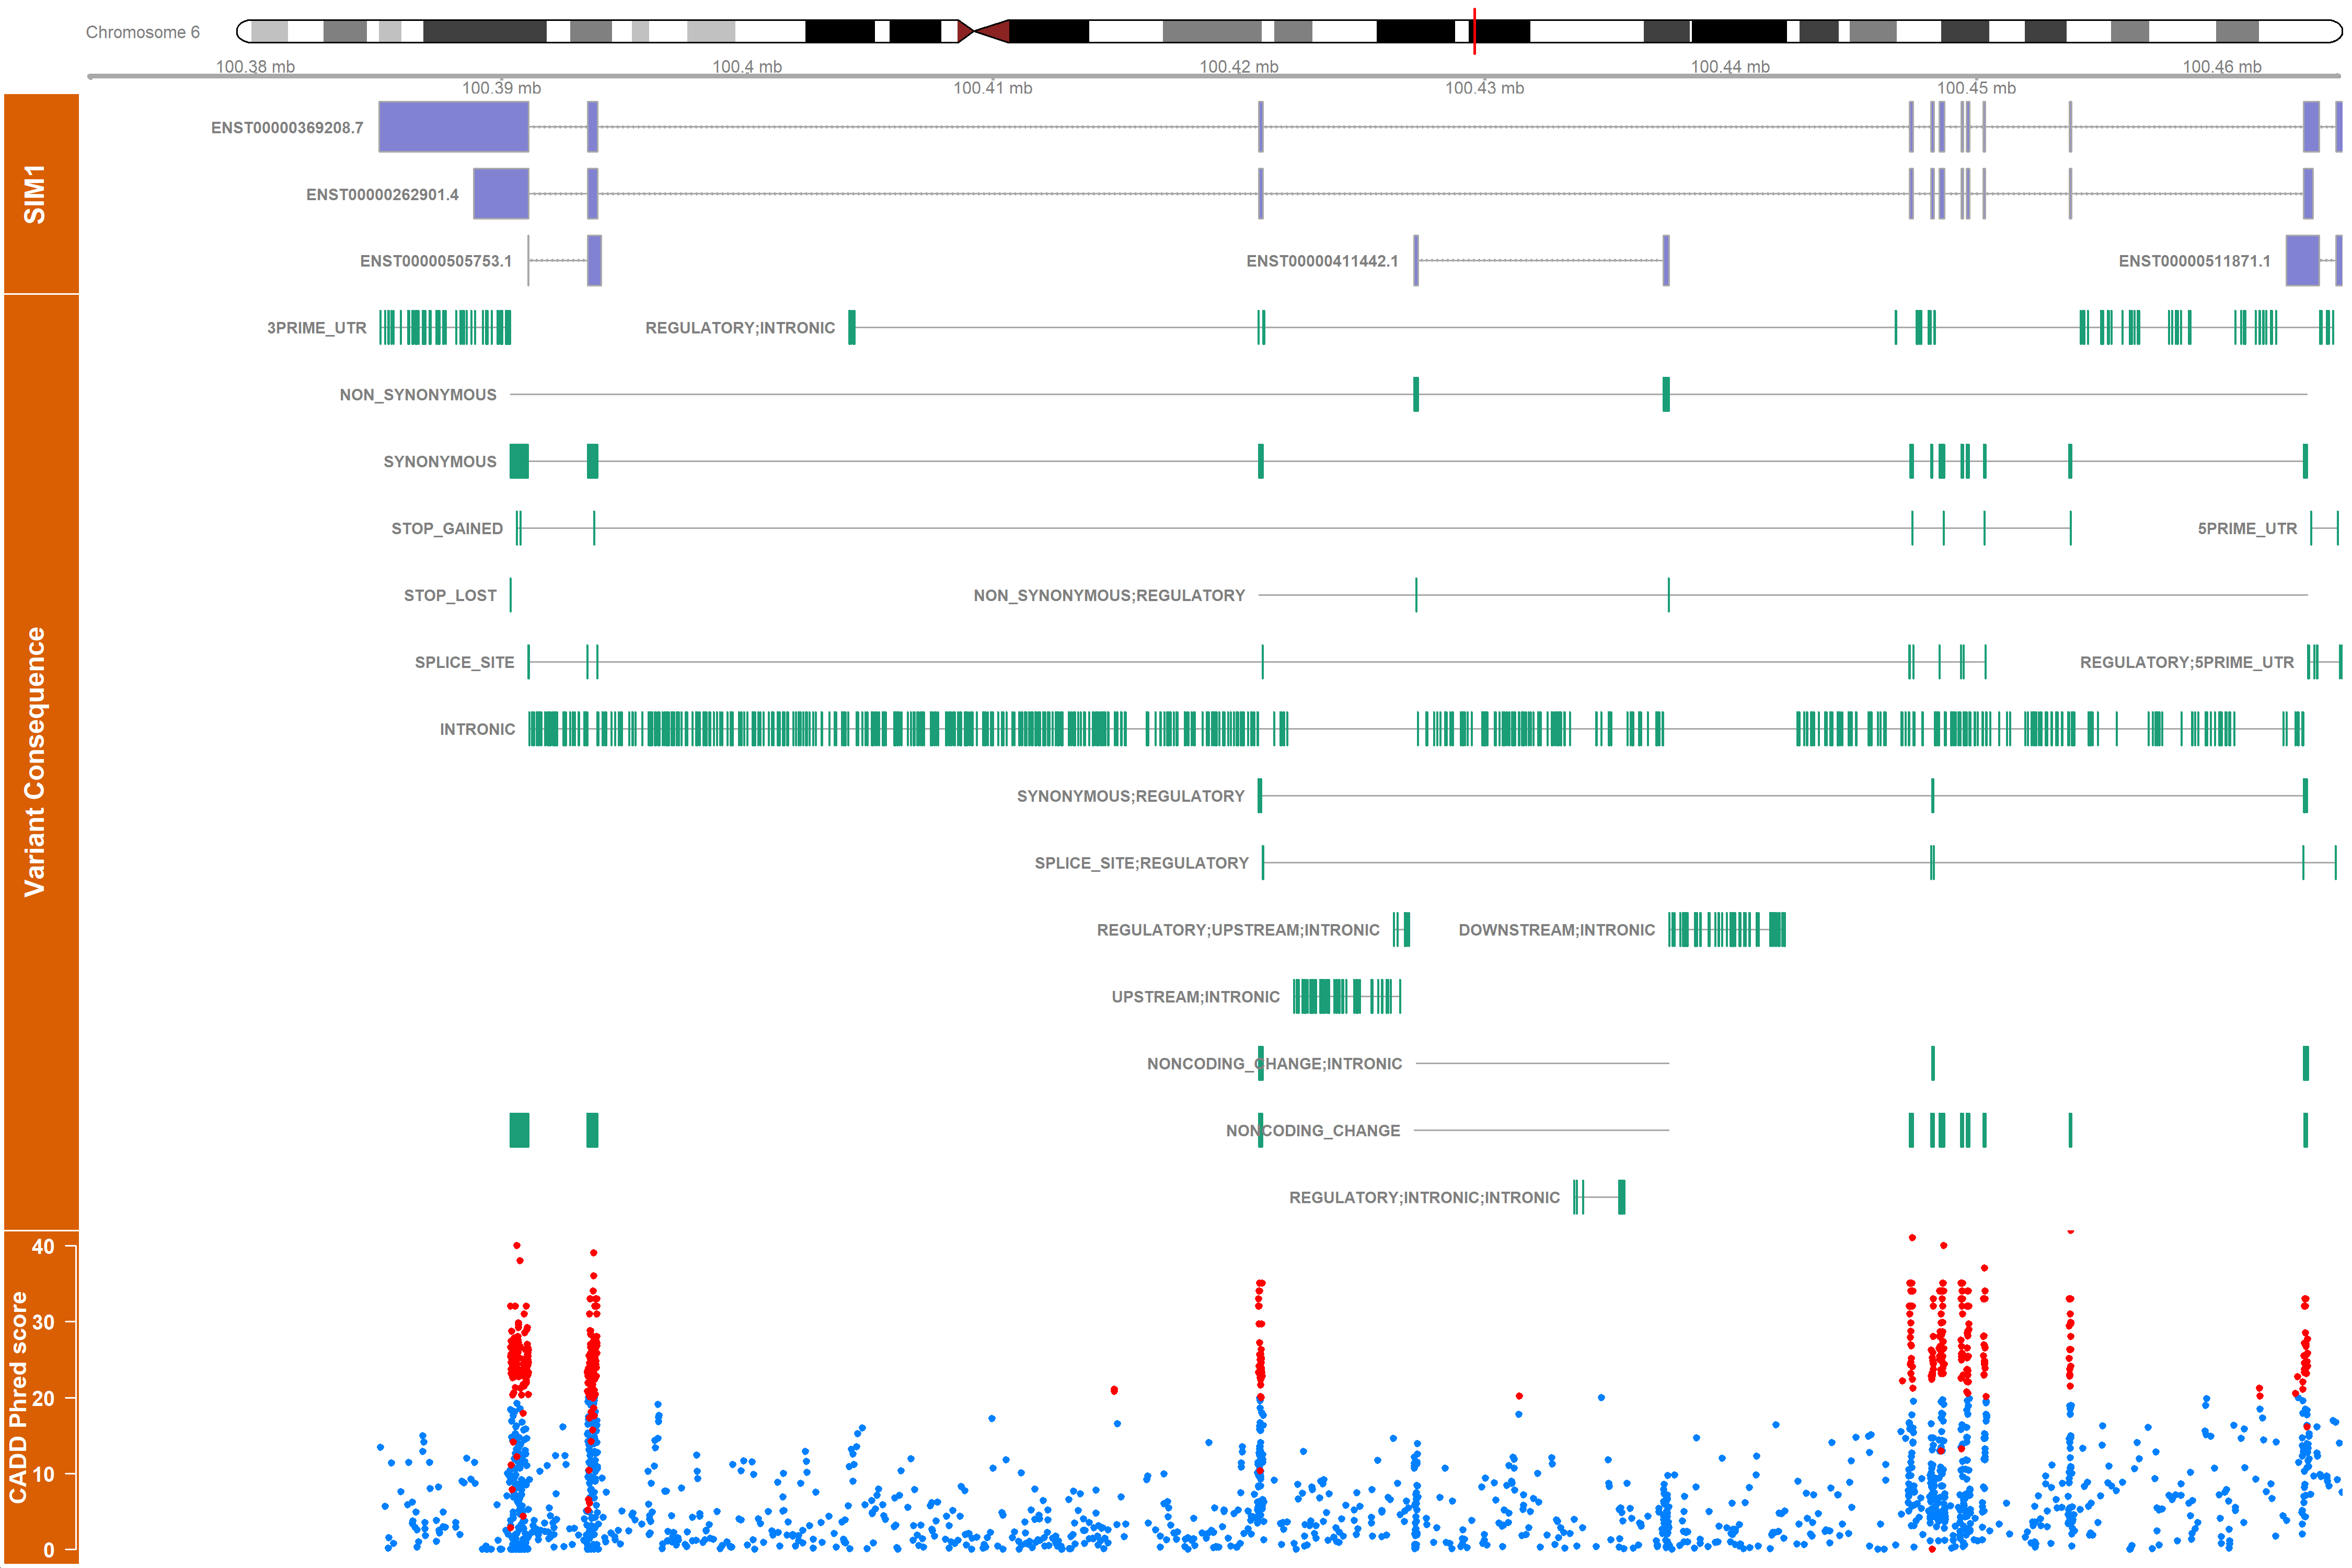
The rsid_highlight parameter allows you to highlight some variants (by rsid) in red:
obesity_vargen_ann <- read.table("OMIM_601665/vargen_variants_annotated.tsv")

gene_mart <- connect_to_gene_ensembl()
vargen_visualisation(annotated_snps = obesity_vargen_ann, verbose = T,
                     outdir = "./obesity_gviz/", device = "png",
                     gene_mart = gene_mart,
                     rsid_highlight = unique(obesity_vargen_ann[obesity_vargen_ann$cadd_phred > 20, "rsid"]))
If you come accross the following error when trying to use VarGen:
Error in bmRequest(request = request, ssl.verifypeer = ssl.verifypeer,  :
  Internal Server Error (HTTP 500).
It means that the ensembl server you are trying to access is not available (by default VarGen tries to access the "www" mirror of ensembl).
To solve this issue, you can try to connect with a different mirror ("useast", "uswest" or "asia"):
gene_ensembl <- connect_to_gene_ensembl(mirror = "useast")
GTEx and Ensembl do not use the same position to refer to the same InDel.
For example with 1_760811_CTCTT_C_b37 (rs200712425):
- GTEx format: CTCTT becomes C.
- Ensembl format: TCTTTCTTT becomes TCTTT.
In both cases TCTT gets deleted, but GTEx refers it from the left (position 760811) and ensembl from the right (position 760812).
Since VarGen was using the position to translate the GTEx id to rsid, "convert_gtex_to_rsids" did not work for InDels. This was corrected in VarGen v0.1.3 (commit: 2ed3488d5976275104647eeae2c87a5f759a0c1a) and now the correct rsids are retrieved.
/!\ However, if there is a SNP at the same position than the InDel, it will also be retrieved.
Update: Since VarGen v0.1.6, the GTEx rsids are retrieved from a lookup table, so this issue is now irrelevant.
In the following example we are assuming that the files described in "Installation" have been installed in the folder "./vargen_data", either manually or by running:
vargen_install("./vargen_data")
- Example 1: "Simple query for Type 1 Diabetes Mellitus"
T1DM_variants <- vargen_pipeline(vargen_dir = "./vargen_data",
                                 omim_morbid_ids = "222100")
- Example 2: "Type 1 Diabetes Mellitus with GTEx"
# First select the tissues of interest (here pancreas)
# it is possible to select more than one tissue (eg: c("pancreas", "adipose"))
pancreas_gtex <- select_gtex_tissues(gtex_dir = "./vargen_data/GTEx_Analysis_v8_eQTL/",
                                     tissues_query = "pancreas")

T1DM_variants <- vargen_pipeline(vargen_dir = "./vargen_data",
                                 omim_morbid_ids = "222100",
                                 gtex_tissues = pancreas_gtex)
- Example 3: "Obesity with GTEx, GWAS and annotation"
# First select the tissues of interest (here adipose)
# it is possible to select more than one tissue (eg: c("pancreas", "adipose"))
adipose_gtex <- select_gtex_tissues(gtex_dir = "./vargen_data/GTEx_Analysis_v8_eQTL/",
                                    tissues_query = "adipose")

# List the available gwas traits:
list_gwas_traits(keywords = "obesity")

# Select gwas traits of interest
gwas_obesity <- c("Obesity (extreme)", "Obesity-related traits", "Obesity", "Obesity (early onset extreme)")

Obesity_variants <- vargen_pipeline(vargen_dir = "./vargen_data",
                                    omim_morbid_ids = "601665",
                                    gtex_tissues = adipose_gtex,
                                    gwas_traits = gwas_obesity,
                                    fantom_corr = 0.25,
                                    verbose = TRUE)

# Annotation of the variants obtained with the previous command:
Obesity_annotation <- annotate_variants(rsid = Obesity_variants$rsid)

# Merging the original output with the annotation:
Obesity_variants_annotated <- merge(Obesity_variants, Obesity_annotation)
View(Obesity_variants_annotated)