The isi_data_insights_d.py script controls a daemon process that can be used to query multiple OneFS clusters for statistics data via the Isilon OneFS Platform API (PAPI). The collector uses a pluggable module for processing the results of those queries. The provided stats processor defined in influxdb_plugin.py sends query results to an InfluxDB backend. Additionally, several Grafana dashboards are provided to make it easy to monitor the health and status of your Isilon clusters. The Connector now supports running under either Python 2 or Python 3.
The collector was developed and tested on Linux. It is written in Python and believed to be portable, but no testing has been performed on other platforms. It is suggested that a Linux VM be provisioned to run the collector and the InfluxDB and Grafana components.
Please note, it is dangerous and unnecessary to install Python packages as root (sudo pip ...). The data insights collector needs no special privileges and can be installed and run as an unprivileged user. Because of this, the recommended way to install the Connector is via a Python virtual environment. The virtual environment installation installs the required Python dependencies into a Python Virtual Environment. The Connector is then run directly from the source directory.
- To install the connector in a virtual environment using the default Python interpreter on the system, run:
./setup_venv.sh- To explicitly install using "python3" as the interpreter, run
./setup_venv3.shThe Grafana visualization component can be downloaded from here
Important note InfluxDB 2.x is incompatible with version 1 and will not work. Please ensure you download and install an InfluxDB version 1.x package (the latest is currently 1.8.10), For installation instructions for the current 1.x (1.8.10) version of Influxdb, refer to this link, scroll down and expand the "Are you interested in InfluxDB 1.x Open Source?" section.
- Rename or copy the example configuration file, example_isi_data_insights_d.cfg, to isi_data_insights_d.cfg. The path ./isi_data_insights_d.cfg is the default configuration file path for the Connector. If you use that name and run the Connector from the source directory then you don't have to use the --config parameter to specify a different configuration file.
- Edit isi_data_insights_d.cfg to configure the collector to query the set of Isilon OneFS clusters that you want to monitor. Do this by modifying the config file's clusters parameter.
- The example configuration file is configured to gather and send several sets of stats to InfluxDB via the influxdb_plugin.py.
- If you installed InfluxDB to somewhere other than localhost and/or port 8086 then you'll also need to update the configuration file with the address and port of the InfluxDB instance.
- Activate the virtualenv it before running the Connector by running:
. .venv/bin/activateor, if you installed the Python 3 version, by running:
. .venv3/bin/activate- To run the Connector:
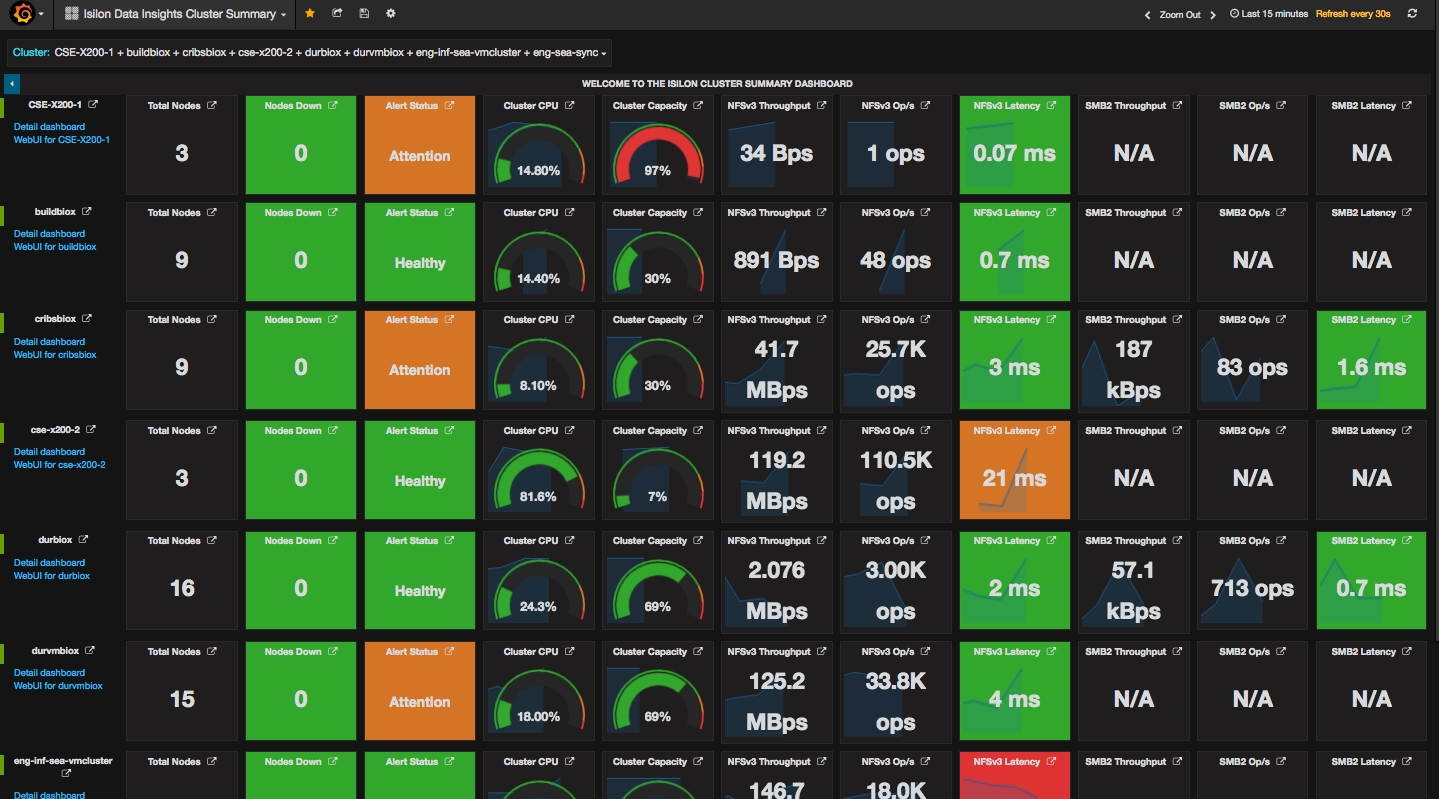
./isi_data_insights_d.py startIncluded with the Connector source code are several Grafana dashboards that make it easy to monitor the health and status of your Isilon clusters. To view the dashboards with Grafana, follow these instructions:
- Install and configure Grafana to use the InfluxDB as a data source. Note that the provided Grafana dashboards have been tested to work with Grafana versions up to and including 8,2,2. Also, note that the influxdb_plugin.py creates and stores the statistics data in a database named isi_data_insights. You'll need that information when following the instructions for adding a data source to Grafana. Also, be sure to configure the isi_data_insights data source as the default Grafana data source using the Grafana Dashboard Admin web-interface.
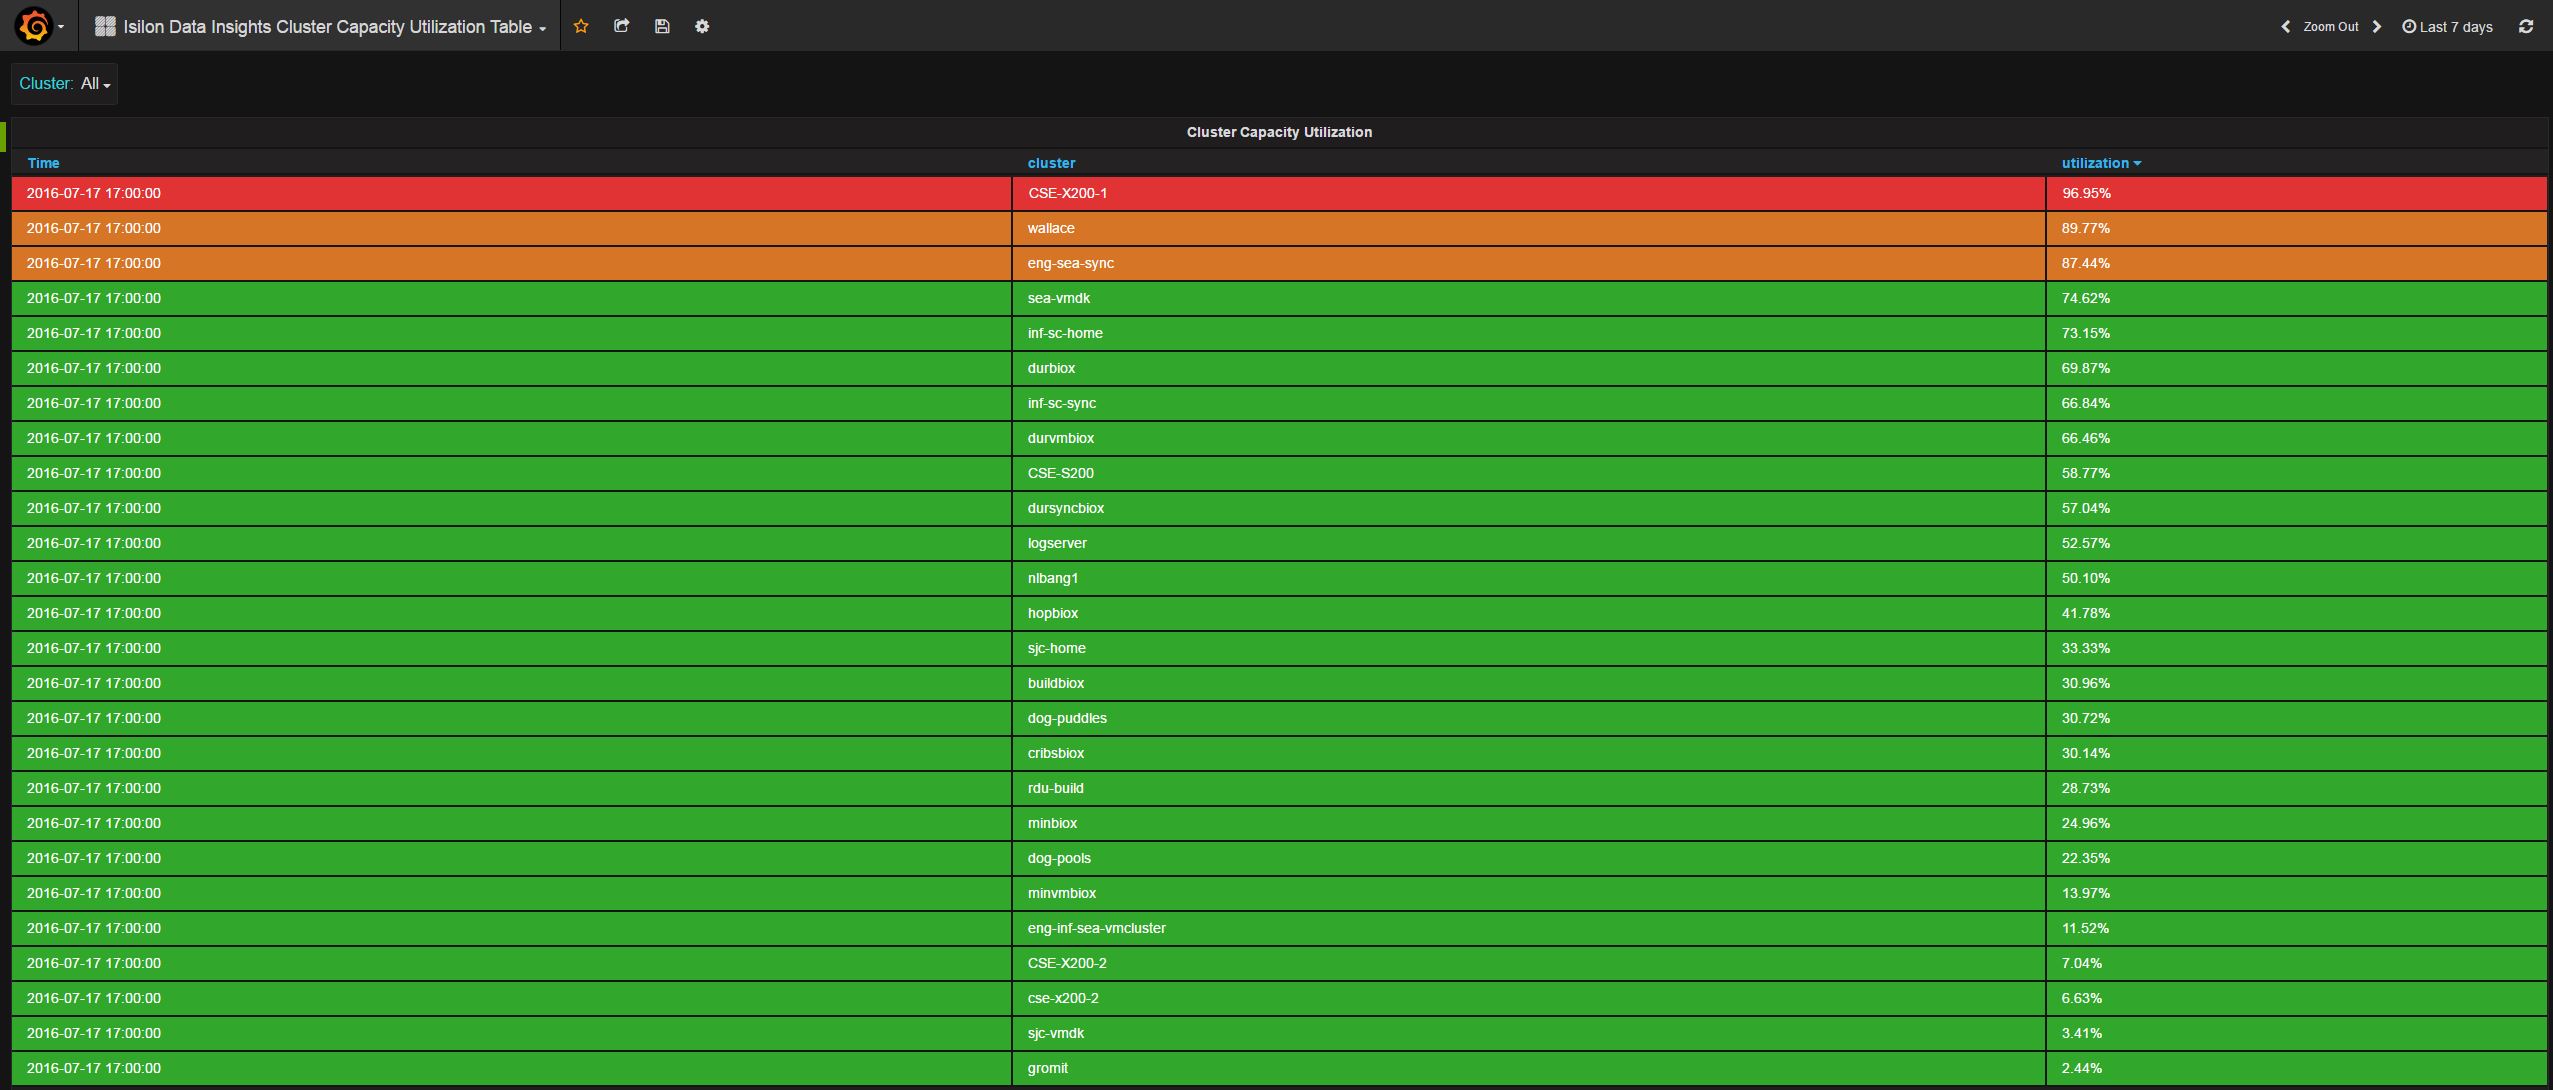
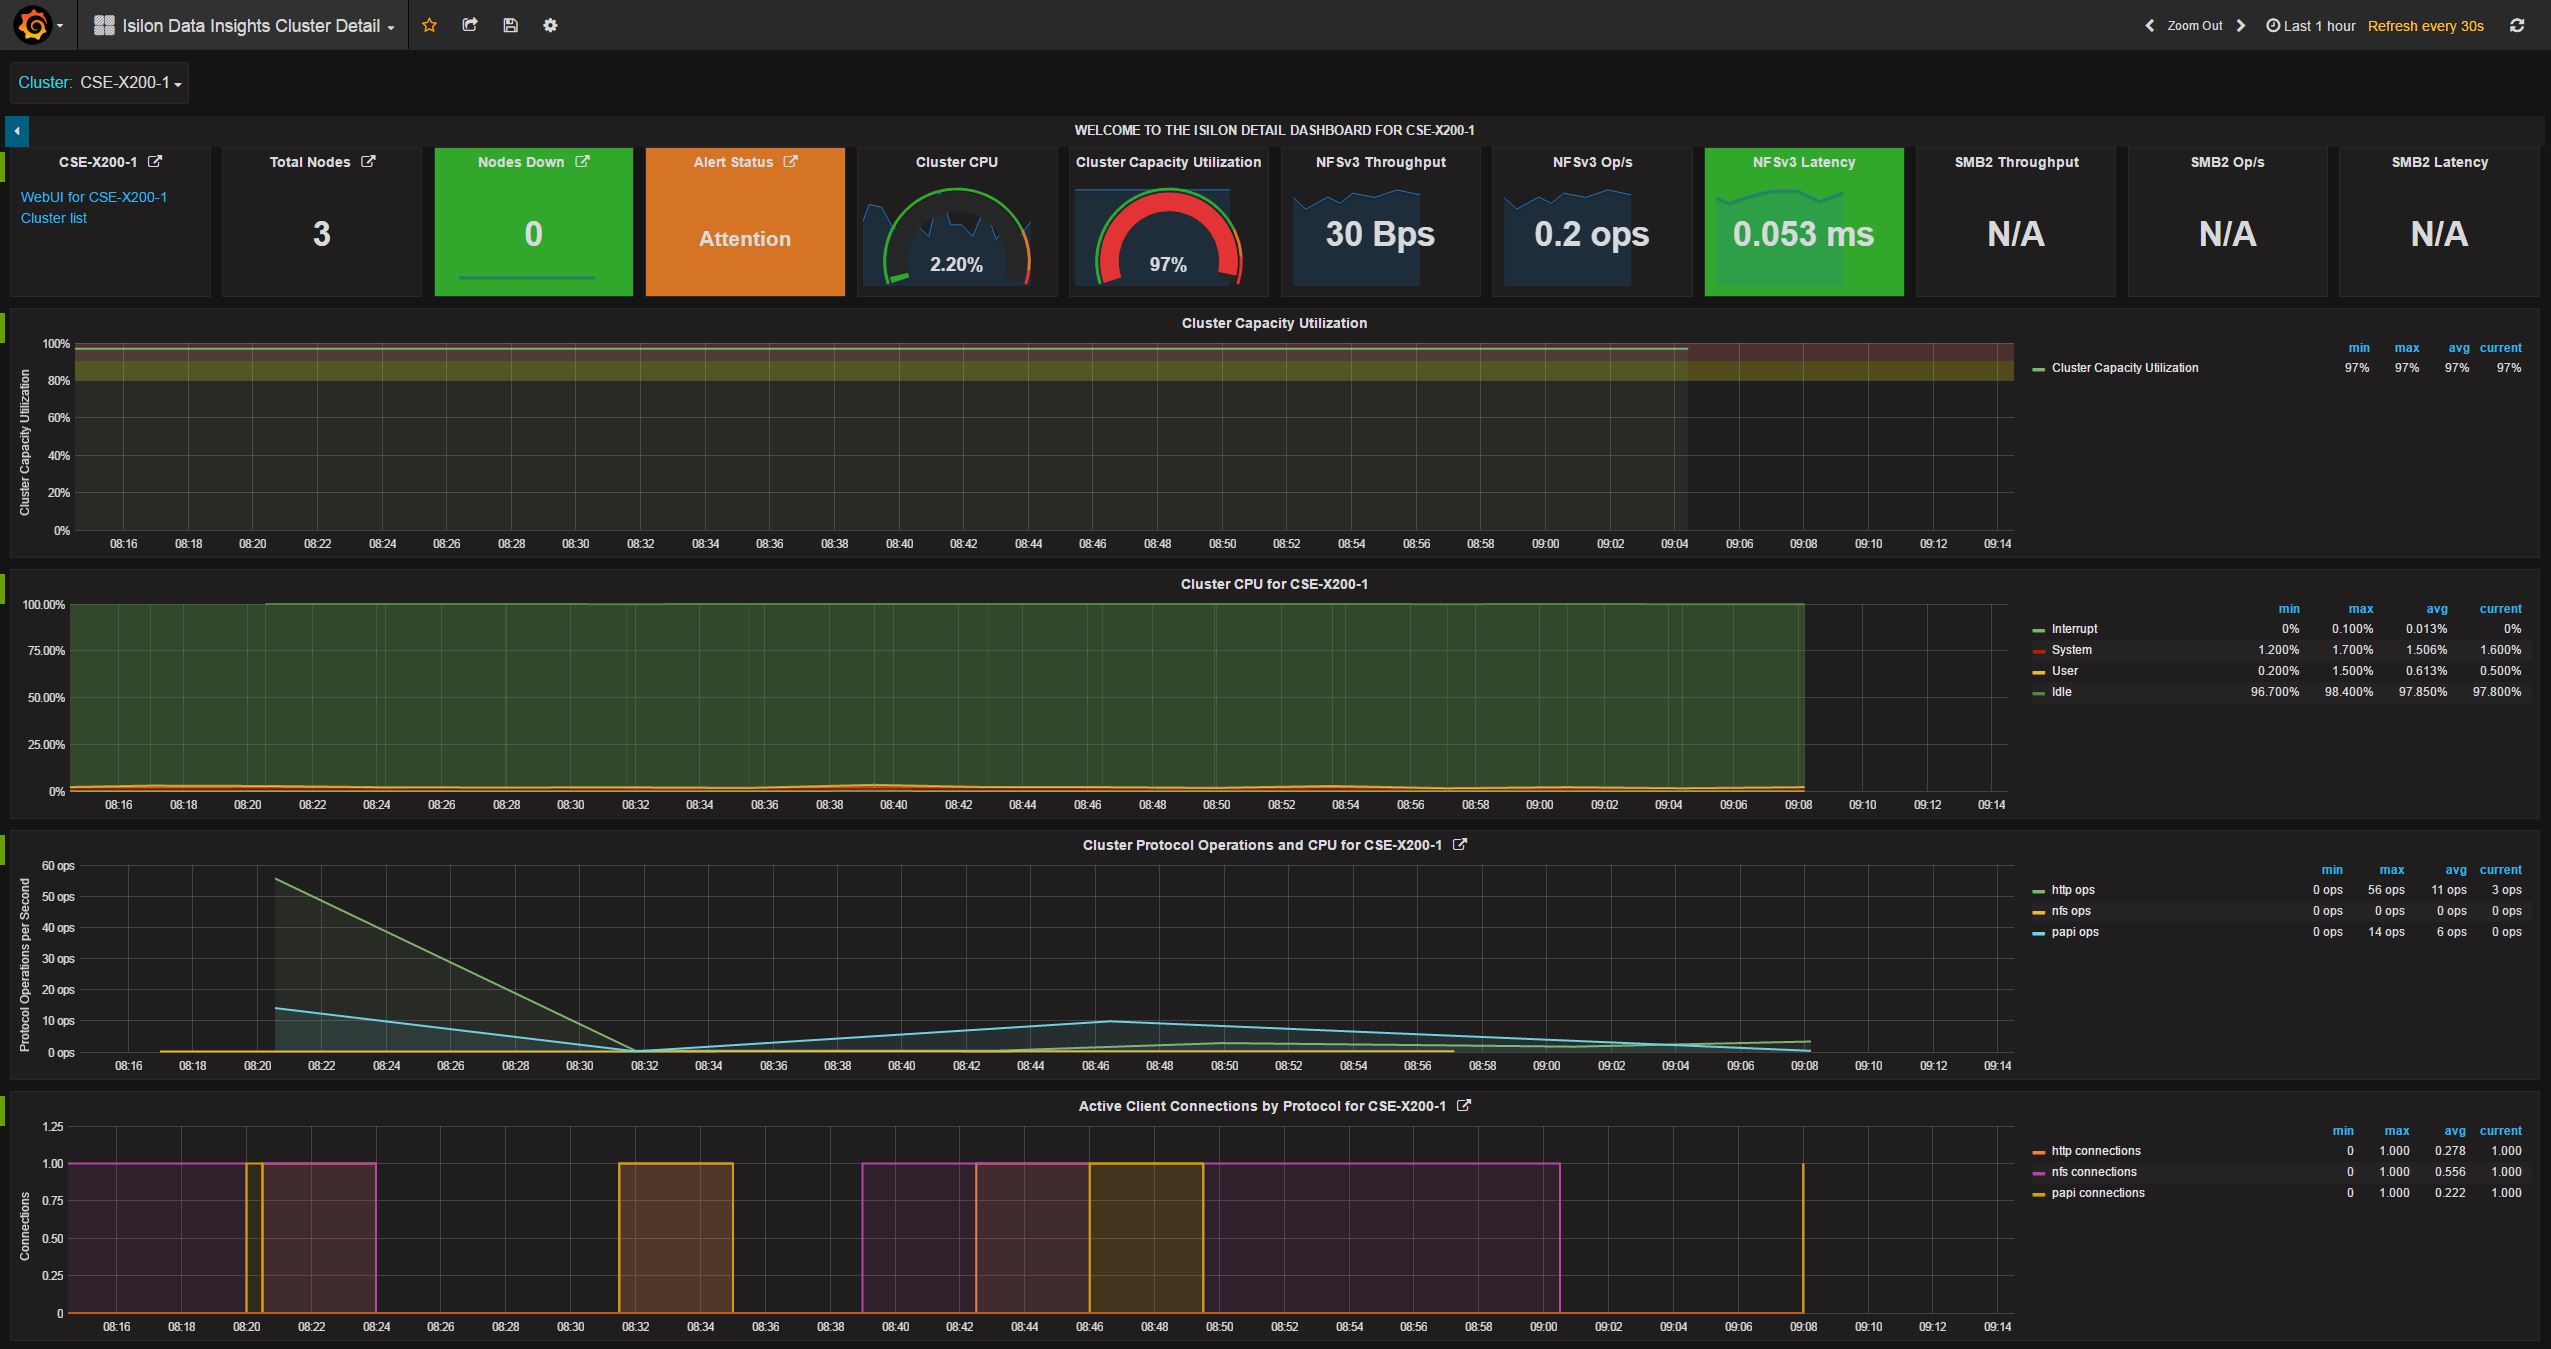
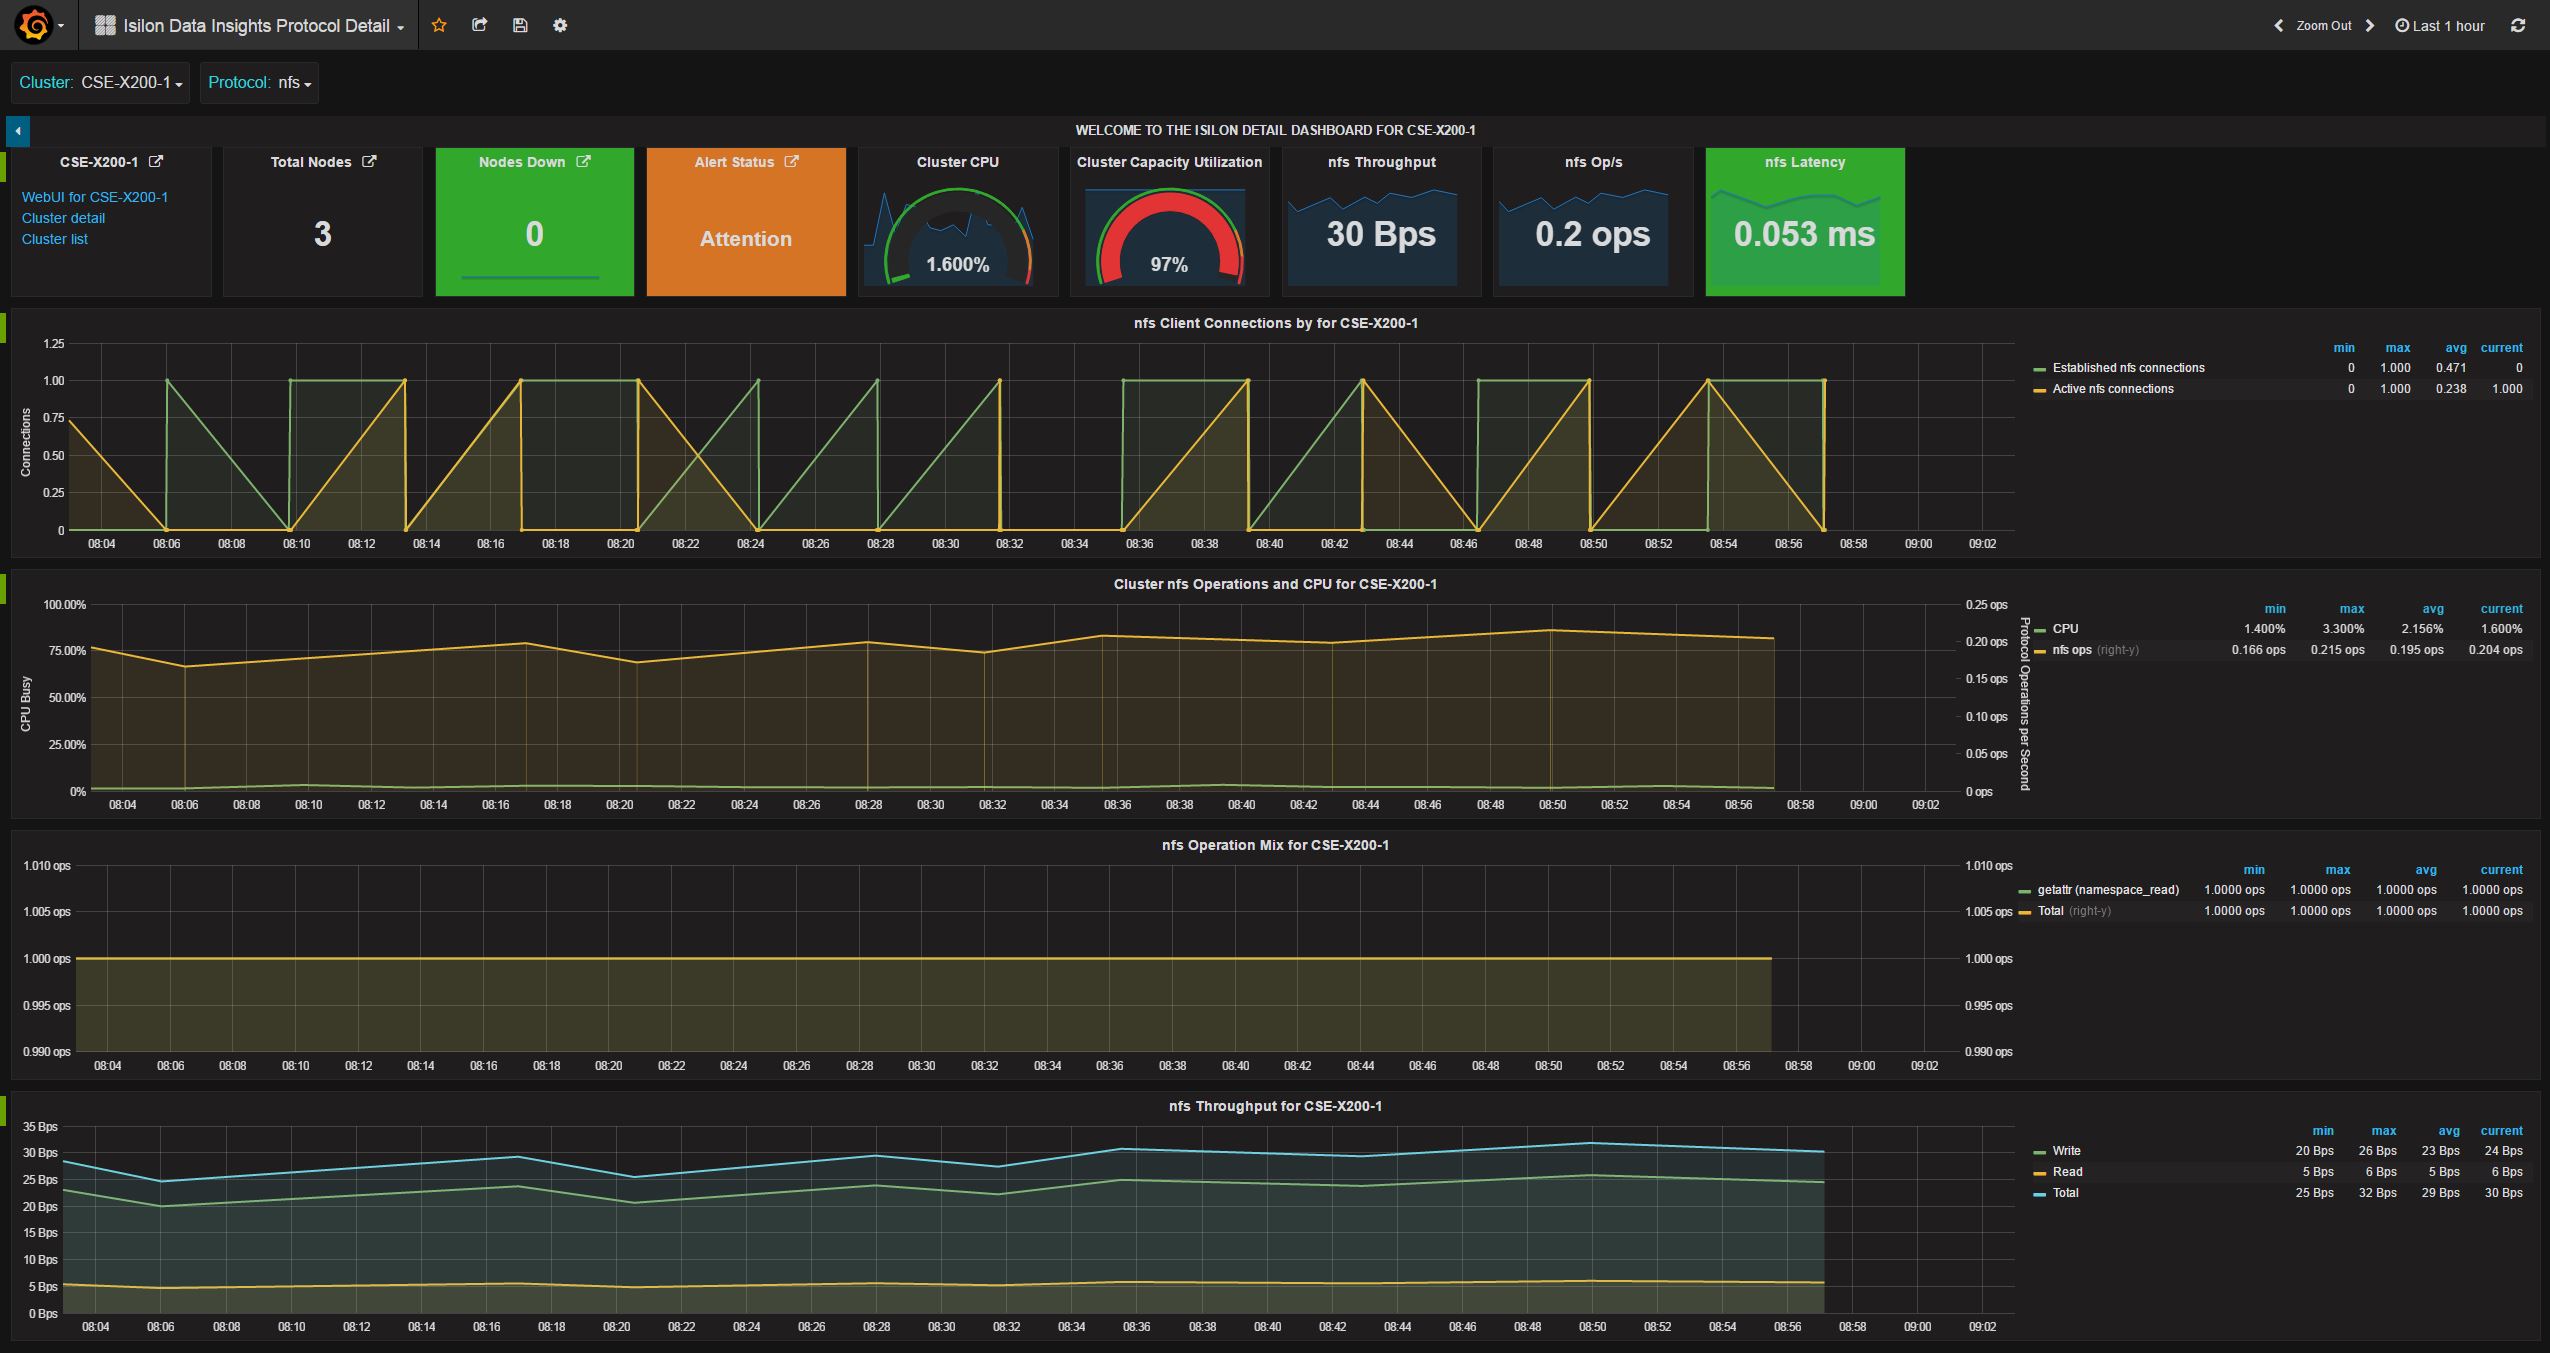
- Import the Grafana dashboards.
- grafana_cluster_list_dashboard.json
- grafana_cluster_capacity_utilization_dashboard.json
- grafana_cluster_detail_dashboard.json
- grafana_cluster_protocol_dashboard.json
- grafana_cluster_list_dashboard.json
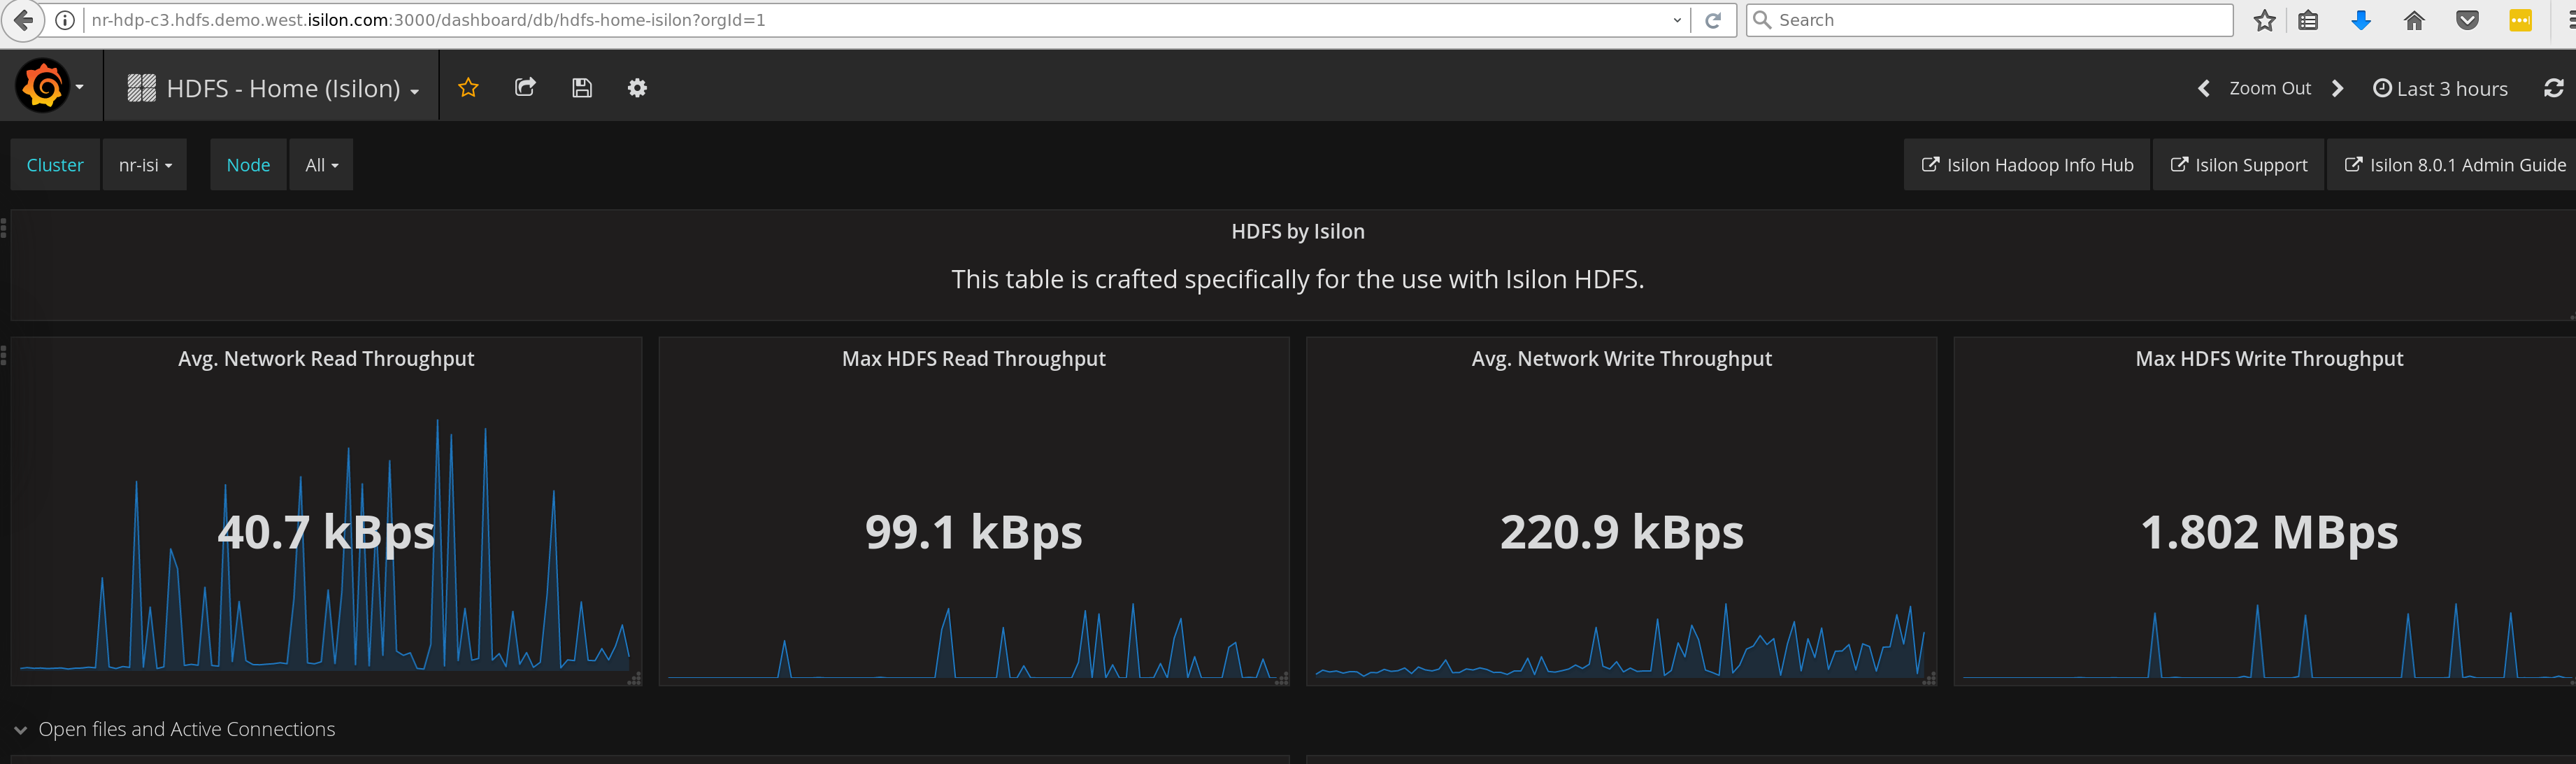
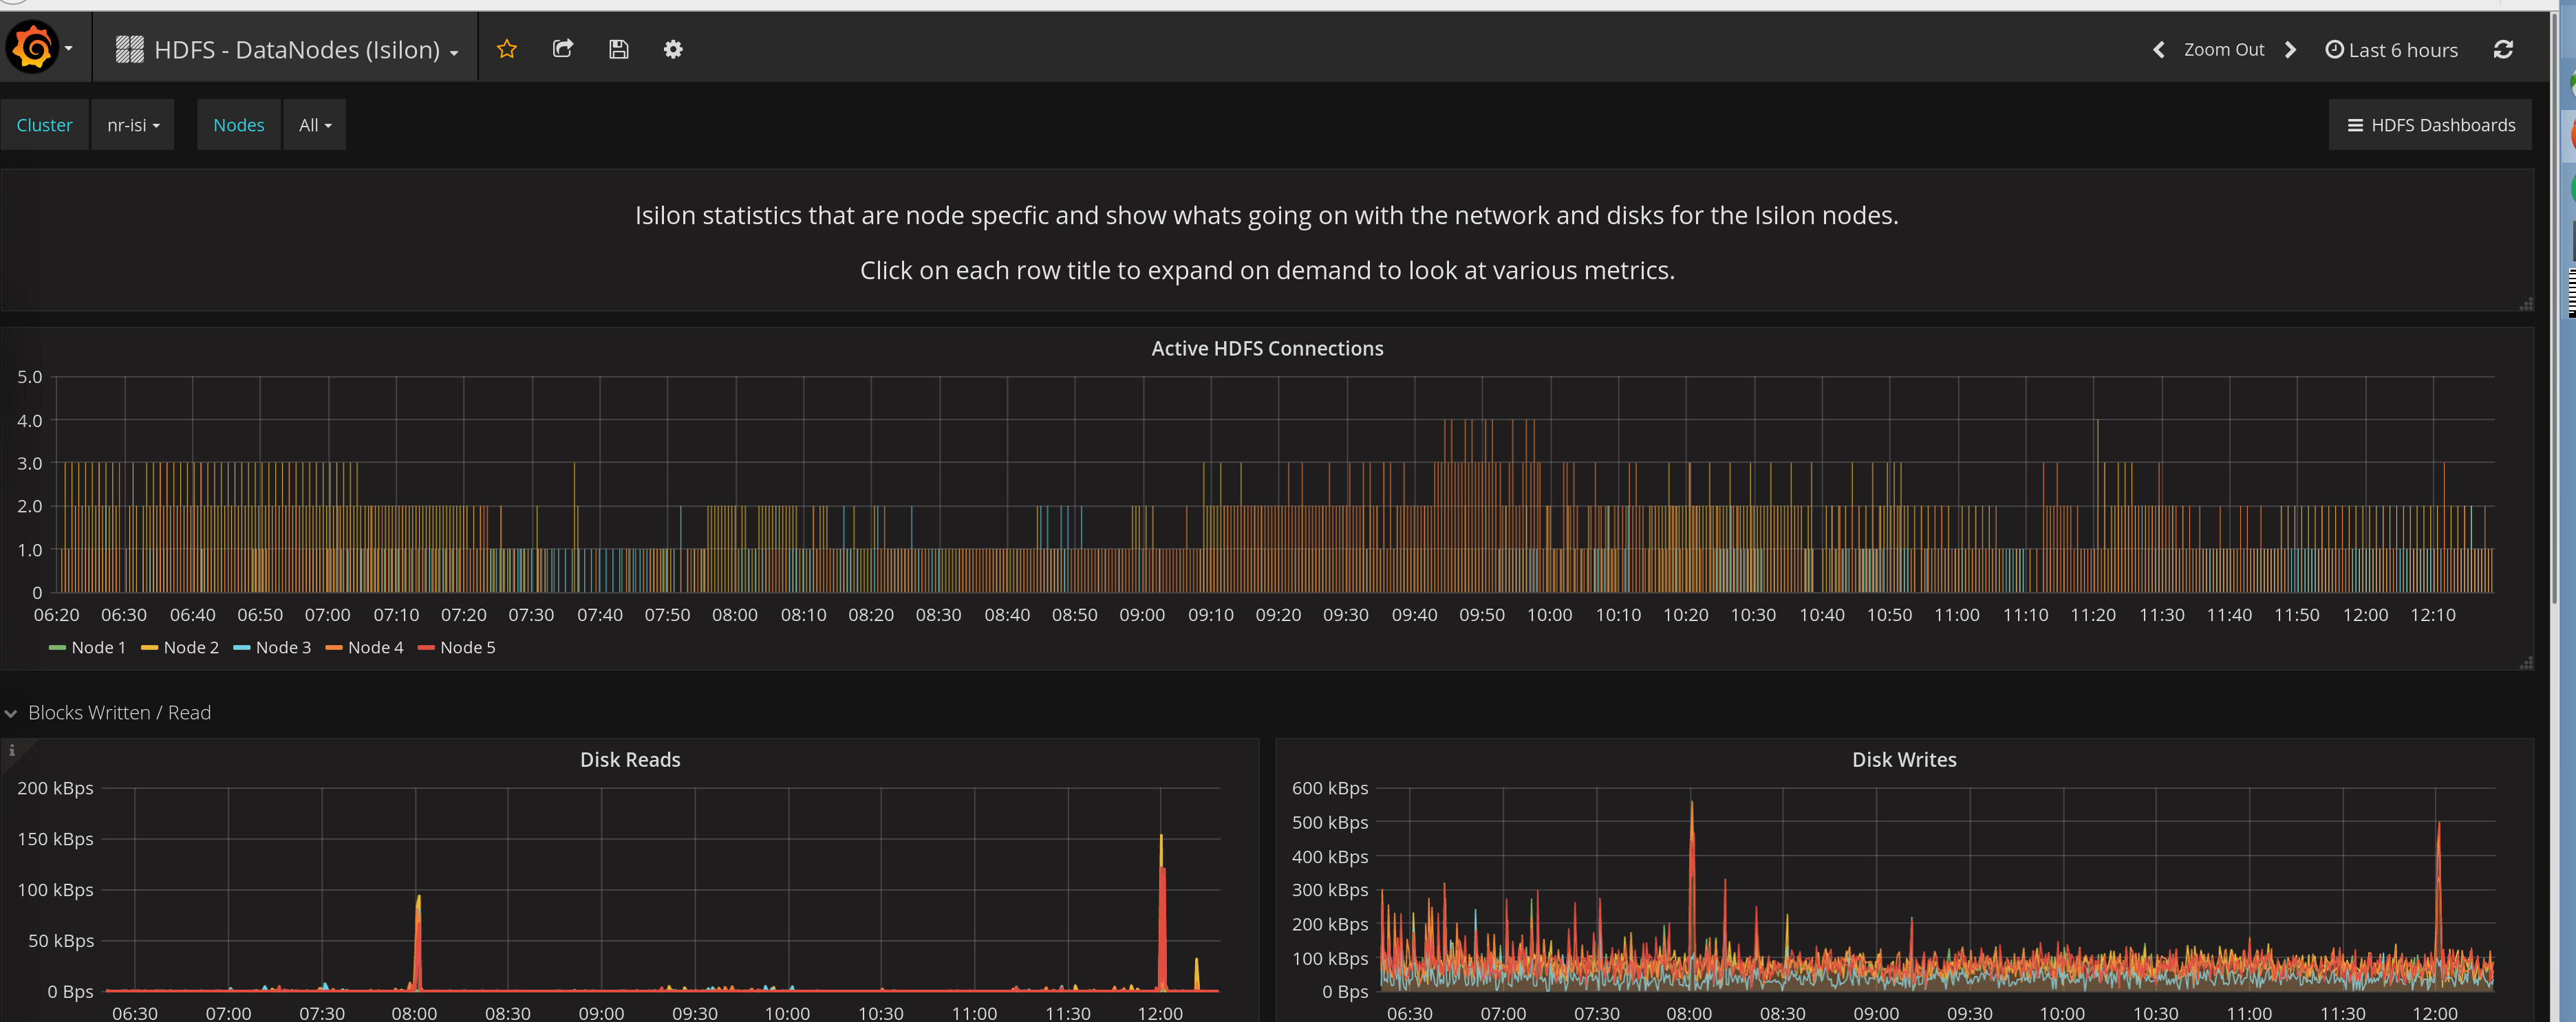
Import (optional) HDFS specific dashboards:
-
grafana_hadoop_home.json
-
grafana_hadoop_datanodes.json
-
If you had previously started the Connector, there should already be data in your database displayed in the dashboards. One common issue that might prevent your dashboards from showing up correctly is if the date/time on your Isilon clusters is not closely enough in-synch with the date/time used by Grafana. Synchronizing the date/time of all the systems to within a few seconds of each other should be enough to fix the issue.
Kapacitor is an add-on component that, when used in conjunction with the Connector enables flexible, configurable, real-time notifications of alert conditions based off the statistics data streaming into the InfluxDB. For more information on how to integrate the Connector and InfluxDB with Kapacitor refer to:
Kapacitor Integration Instructions
The Connector is designed to allow for customization via a plugin architecture. The default plugin, influxd_plugin.py, is configured via the provided example configuration file. If you would like to process the stats data differently or send them to a different backend than the influxdb_plugin.py you can implement a custom stats processor. Here are the instructions for doing so:
- Create a file called my_plugin.py, or whatever you want to name it.
- In the my_plugin.py file define a process(cluster, stats) function that takes as input the name/ip-address of a cluster and a list of stats. The list of stats will contain instances of the isi_sdk_8_0/models/CurrentStatisticsStat class or isi_sdk_7_2/models/CurrenStatisticsStat class, but it makes no difference because the two classes are the same regardless of the version.
- Optionally define a start(argv) function that takes a list of input args as defined in the config file via the stats_processor_args parameter.
- Optionally define a stop() function.
- Put the my_plugin.py file somewhere in your PYTHONPATH (easiest is to put into the same directory as the other Python source code files).
- Update the isi_data_insights_d.cfg file with the name of your plugin (i.e. 'my_plugin')
- Restart the isi_data_insights_d.py daemon:
./isi_data_insights_d.py restartThere are multiple ways for anyone using the Connector to interact with our dev team to request new features or discuss problems.
- Create a new issue on the Issues tab.
- Use the discussion capability of the Isilon SDK Info Hub page.
Also, just like an other project on github.com we are entirely open to external code contributions:
- Fork the project, modify it, then initiate a pull request.