A Chassis extension to install and configure Xdebug on your Chassis server.
We recommend installing this extension globally to make it available on every Chassis box.
git clone https://github.com/Chassis/Xdebug ~/.chassis/extensions/xdebug
- Add this extension to your extensions directory
git clone git@github.com:Chassis/Xdebug.git extensions/xdebugor alternatively add the following to one of your.yamlfiles:extensions: - chassis/xdebug - Set your
config.local.yamlPHP version to 5.6 or higher. - Run
vagrant provision. - By default PHPSTORM is the default IDE. This can be overridden in your any of your
.yamlfiles by adding in:ide: ATOMand replacing ATOM with your IDE of choice. If you do this then please be sure to change your IDE Key in the Xdebug Helper extension mentioned below. - By default
9000is the port forxdebug.remote_port. In some cases you may need to change this, depending on what other services are running on your machine. This can be overridden in your any of your.yamlfiles by adding in:port: 9001and replacing 9001 with your port of choice. If you do this then please be sure to change the port your IDE is listening to for DBGP connections. - Here's an example
.yamlfile based on the above configuration:ide: ATOM port: 9001
- Run
vagrant provisionso that the new values are set in your virtual machine. - Configure your browser and your IDE, set a breakpoint, and happy debugging!
- Install the Xdebug Helper.
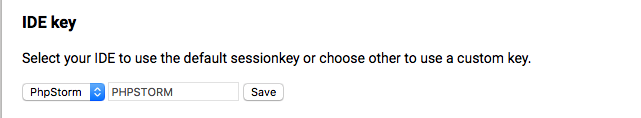
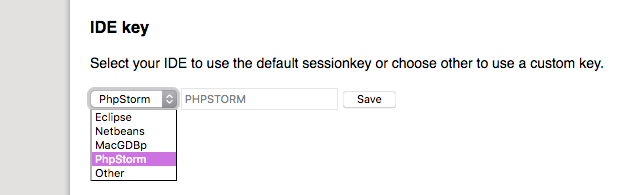
- Go to
Settings -> More Tools -> Extensionsin Google Chrome. - Scroll down to
Xdebug helperand click Options. - Select your editor in the IDE key dropdown, or select "Other" and enter a custom key if your editor is not listed e.g.
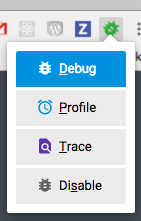
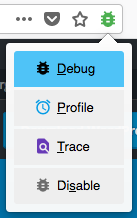
- Enable Xdebug Helper. e.g.
- Install the Xdebug Helper.
- Go to
Menu > Add Ons > Extensionsin Firefox. - Scroll to
Xdebug helperand click Preferences. - Select your editor in the IDE key dropdown, or select "Other" and enter a custom key if your editor is not listed e.g.
- Enable Xdebug Helper. e.g.
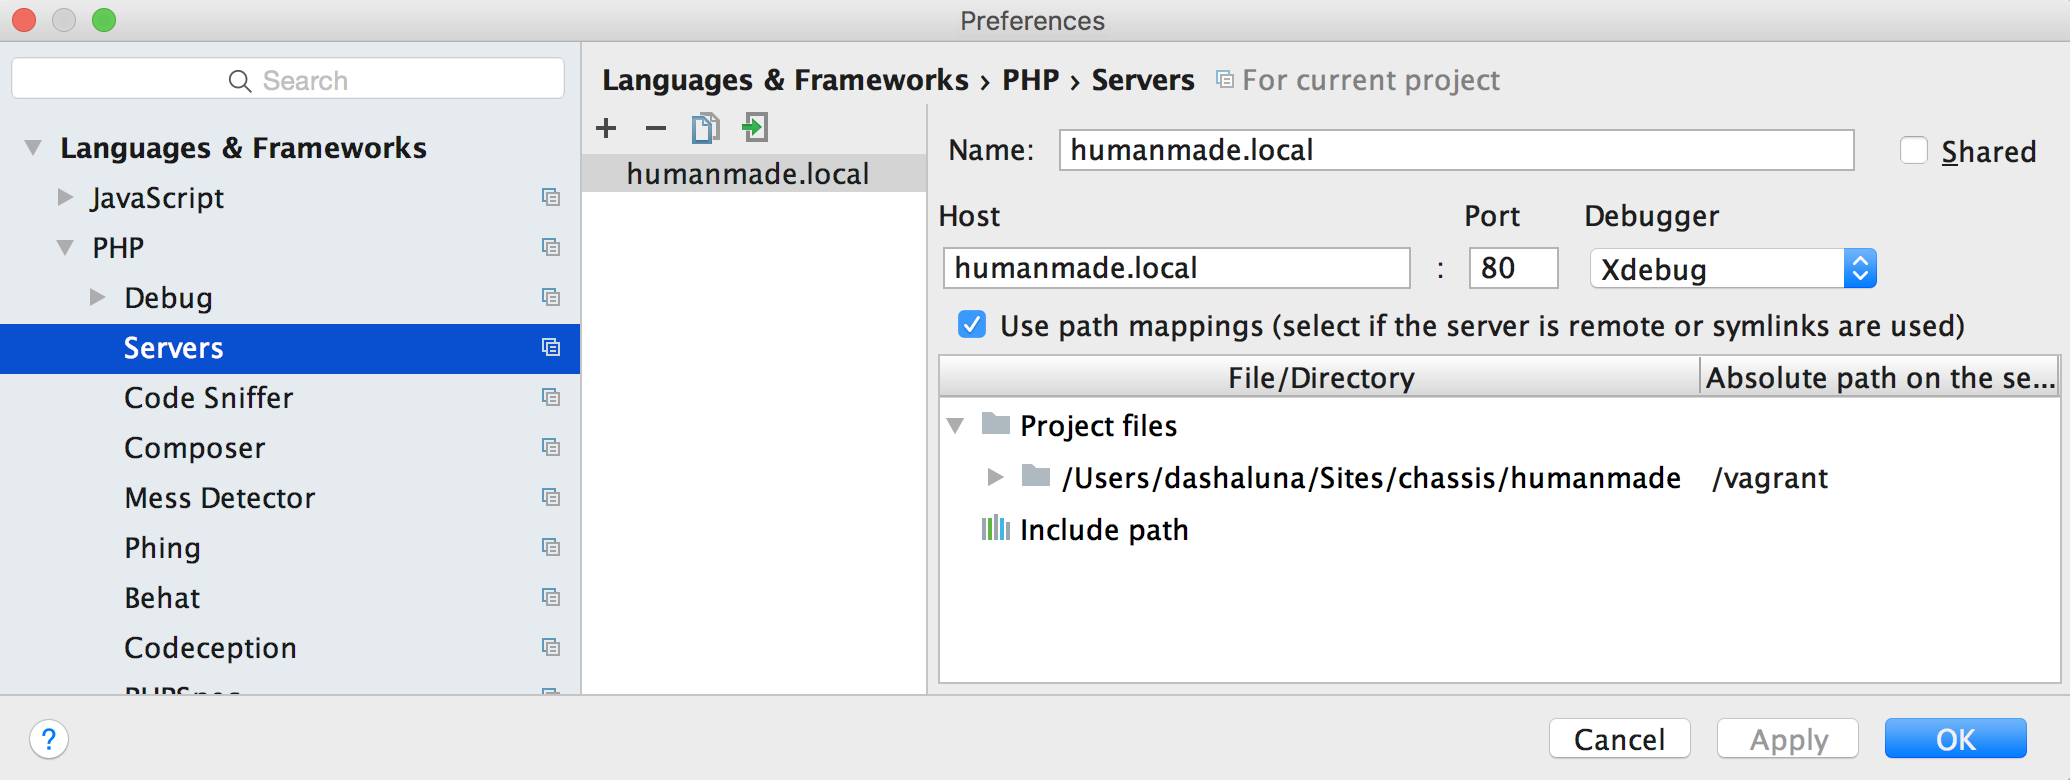
- Go to
Preferences -> Languages + Frameworks -> PHP -> Serversand add a mapping for your website.
File/Directoryshould be set to chassis folder (i.e. where theVagrantfileis in).Absolute path on the servershould be set to/vagrantor if you are using paths this will be/chassis. e.g.
- Enable
Start Listening for PHP Debug Connectionse.g. - Set a breakpoint in PhpStorm, refresh the page you with to debug in the browser, and start debugging!

- Go to the VS Code Extensions manager (or enter "Install Extensions" in the command palette) and install & activate the PHP Debug extension.
- Go to the Debug tab in the sidebar and click the small gear icon at the top of the left column; select "PHP" from the menu that will pop up to auto-create a
launch.jsonPHP debugging configuration file in your project
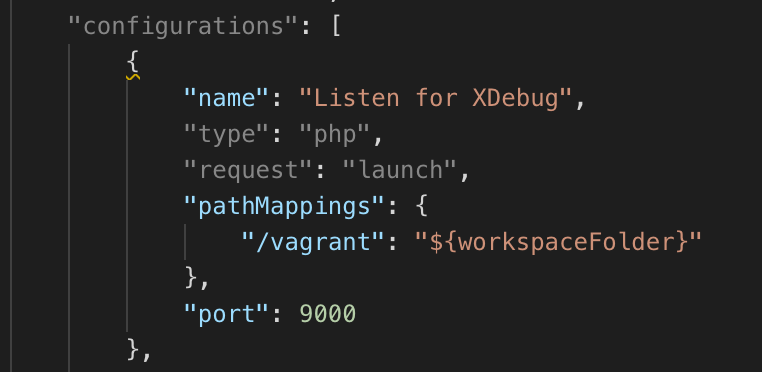
- Add a "pathMappings" key to the "Listen for Xdebug" launch configuration to map the
${workspaceFolder}to the/vagrantor/chassis(if you are using paths) directory within the virtual machine e.g. - Click
Start Debuggingin the left column of the Debug tab e.g.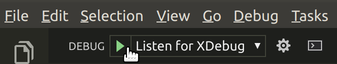
- Set a breakpoint in VS Code, refresh the page you with to debug in the browser, and start debugging!
- Go to Preferences -> PHP -> Debug -> Debuggers
- Add Xdebug in the Supported PHP Debuggers section.
- Change your settings to the following

If you'd like to enable Xdebug Profiling you can do so by doing either of the following:
- Append
?XDEBUG_PROFILE=1to a URL you'd like to profile. - Add
1to the Xdebug Helper.
- The profiling logs will be save on your Chassis VM under
/tmp. You'll need tovagrant sshthencd /tmpto view them.

If you're having issues with XDebug not working then there is a chance that port 9000 is being used by some other software on your computer. To work around this change the port number to another value. e.g. 9001 and run vagrant provision.
When using VS Code specifically, if the debug session immediately stops after clicking the "run" button next to your "Listen for XDebug" task you should try fully uninstalling and then reinstalling the PHP Debug extension.