An interactive visualization of American gun trends (turn off safe scripts)
#An Interactive Exploration Into American Gun Data
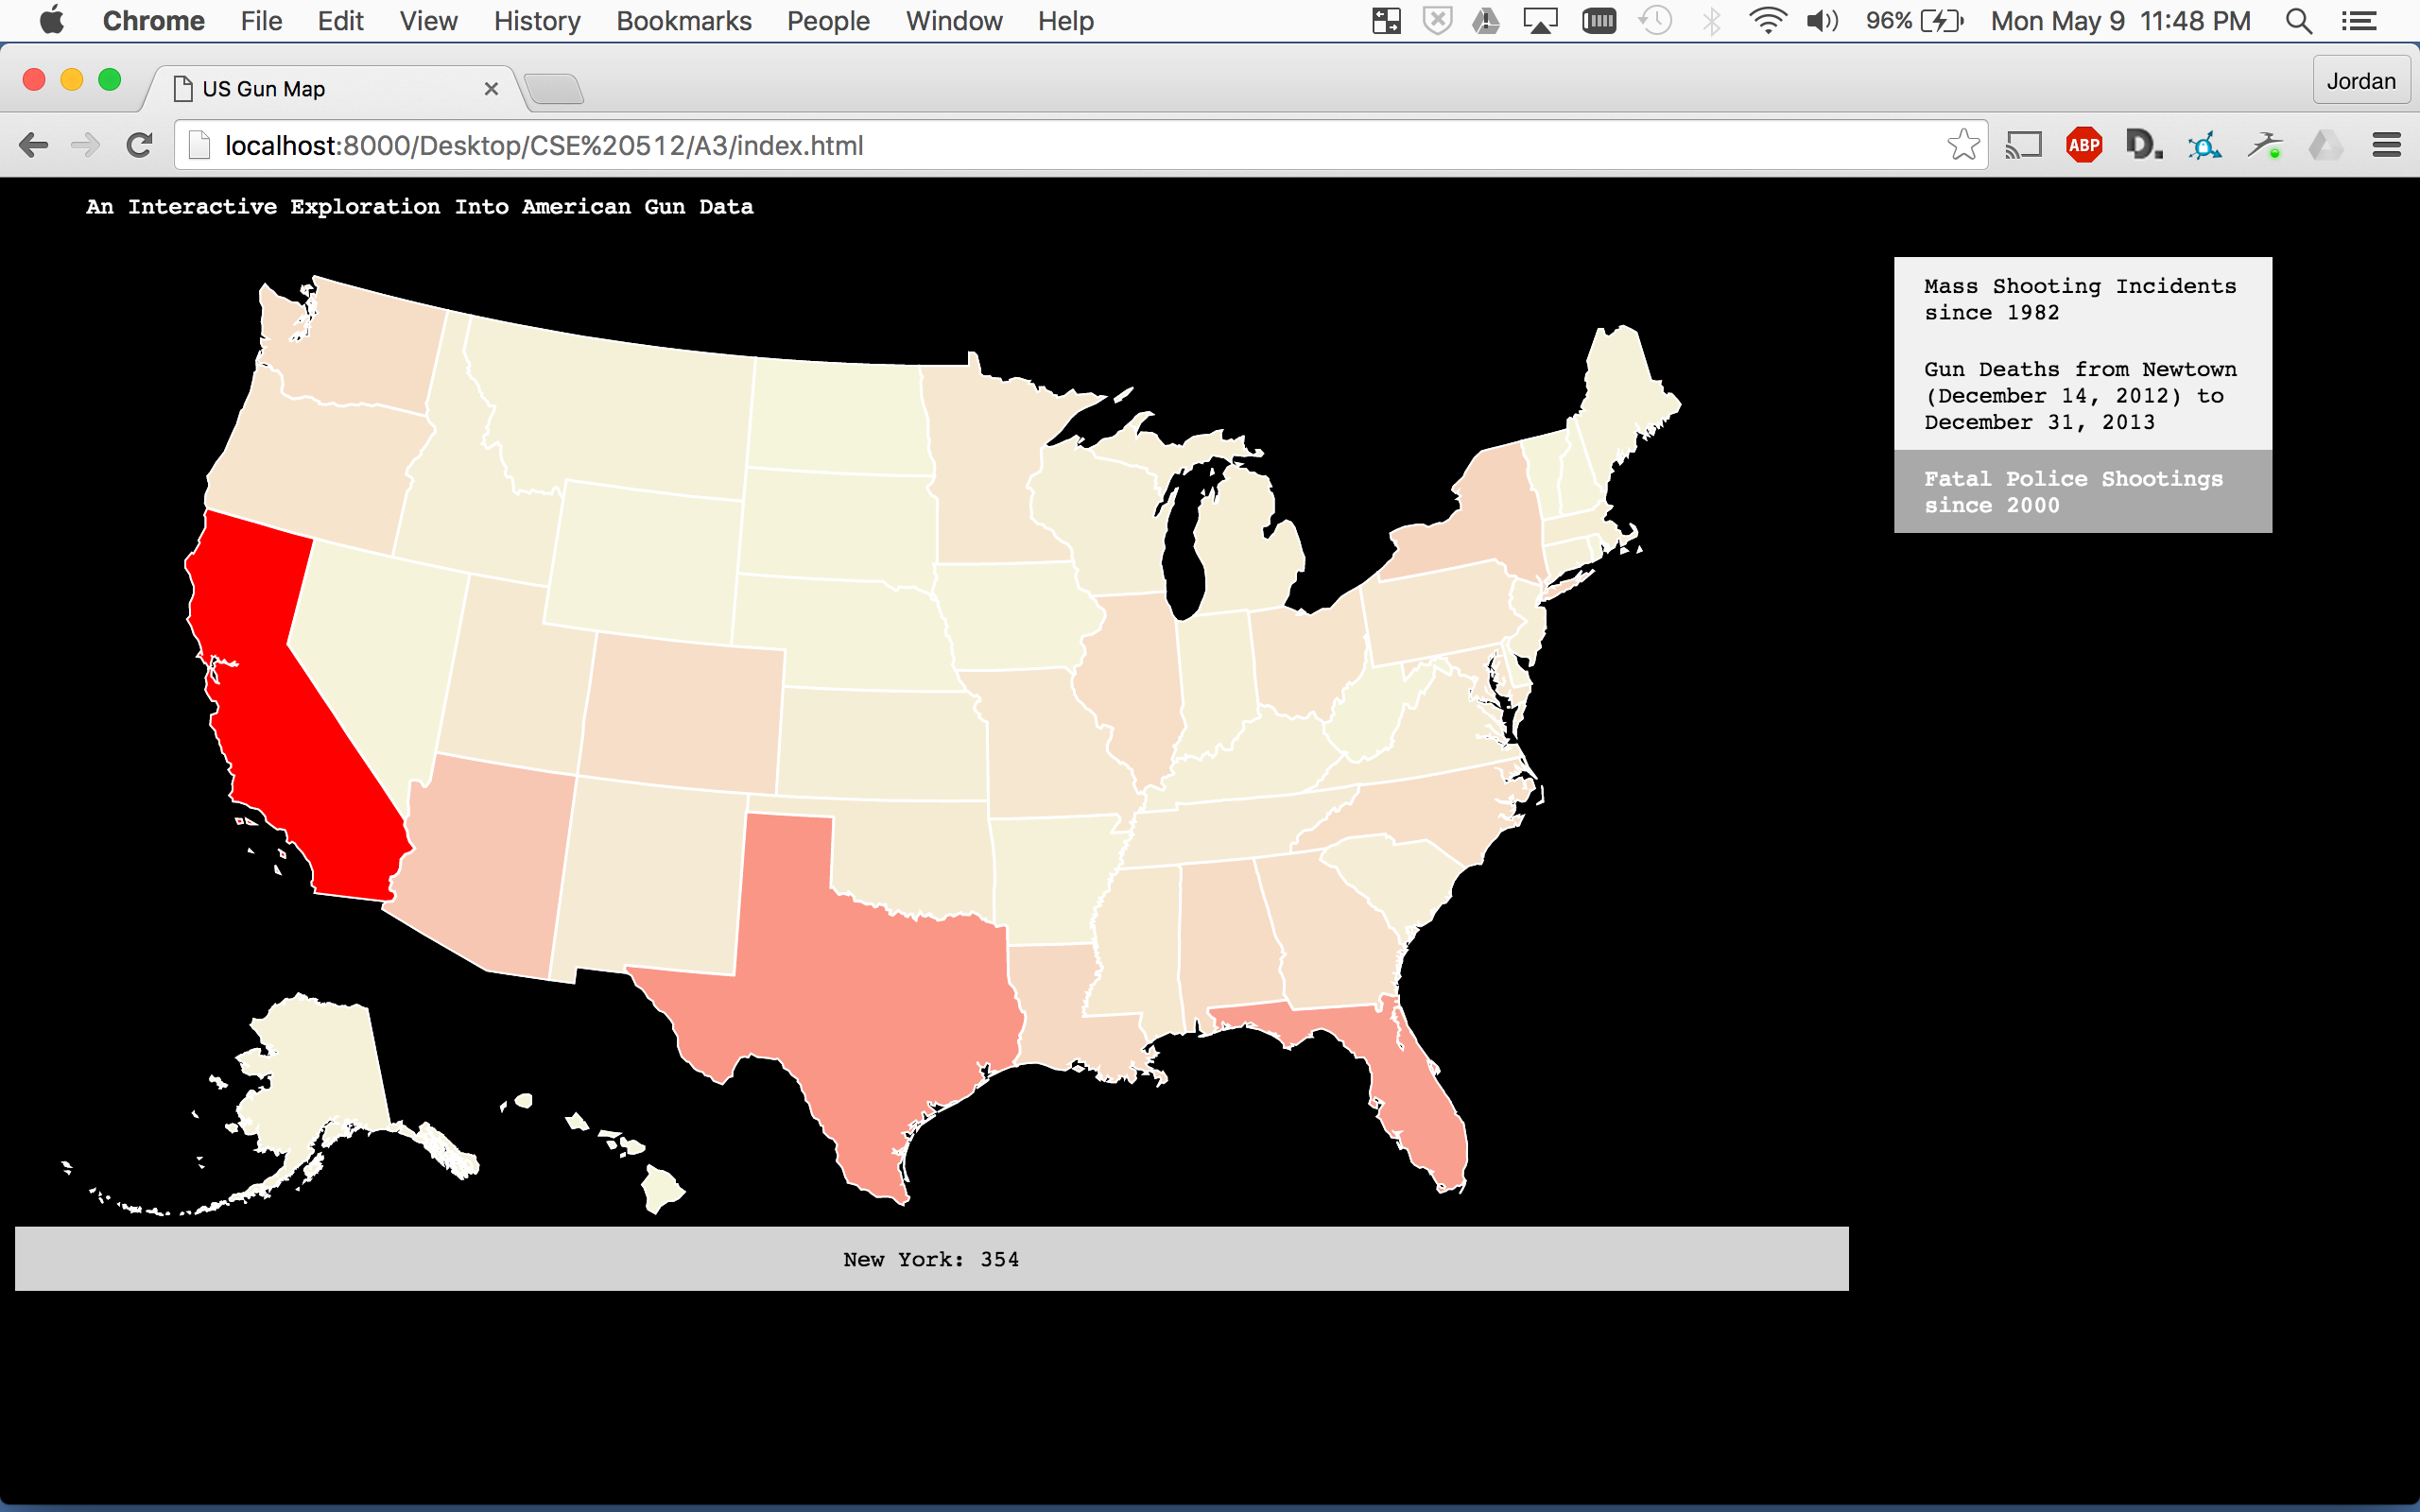
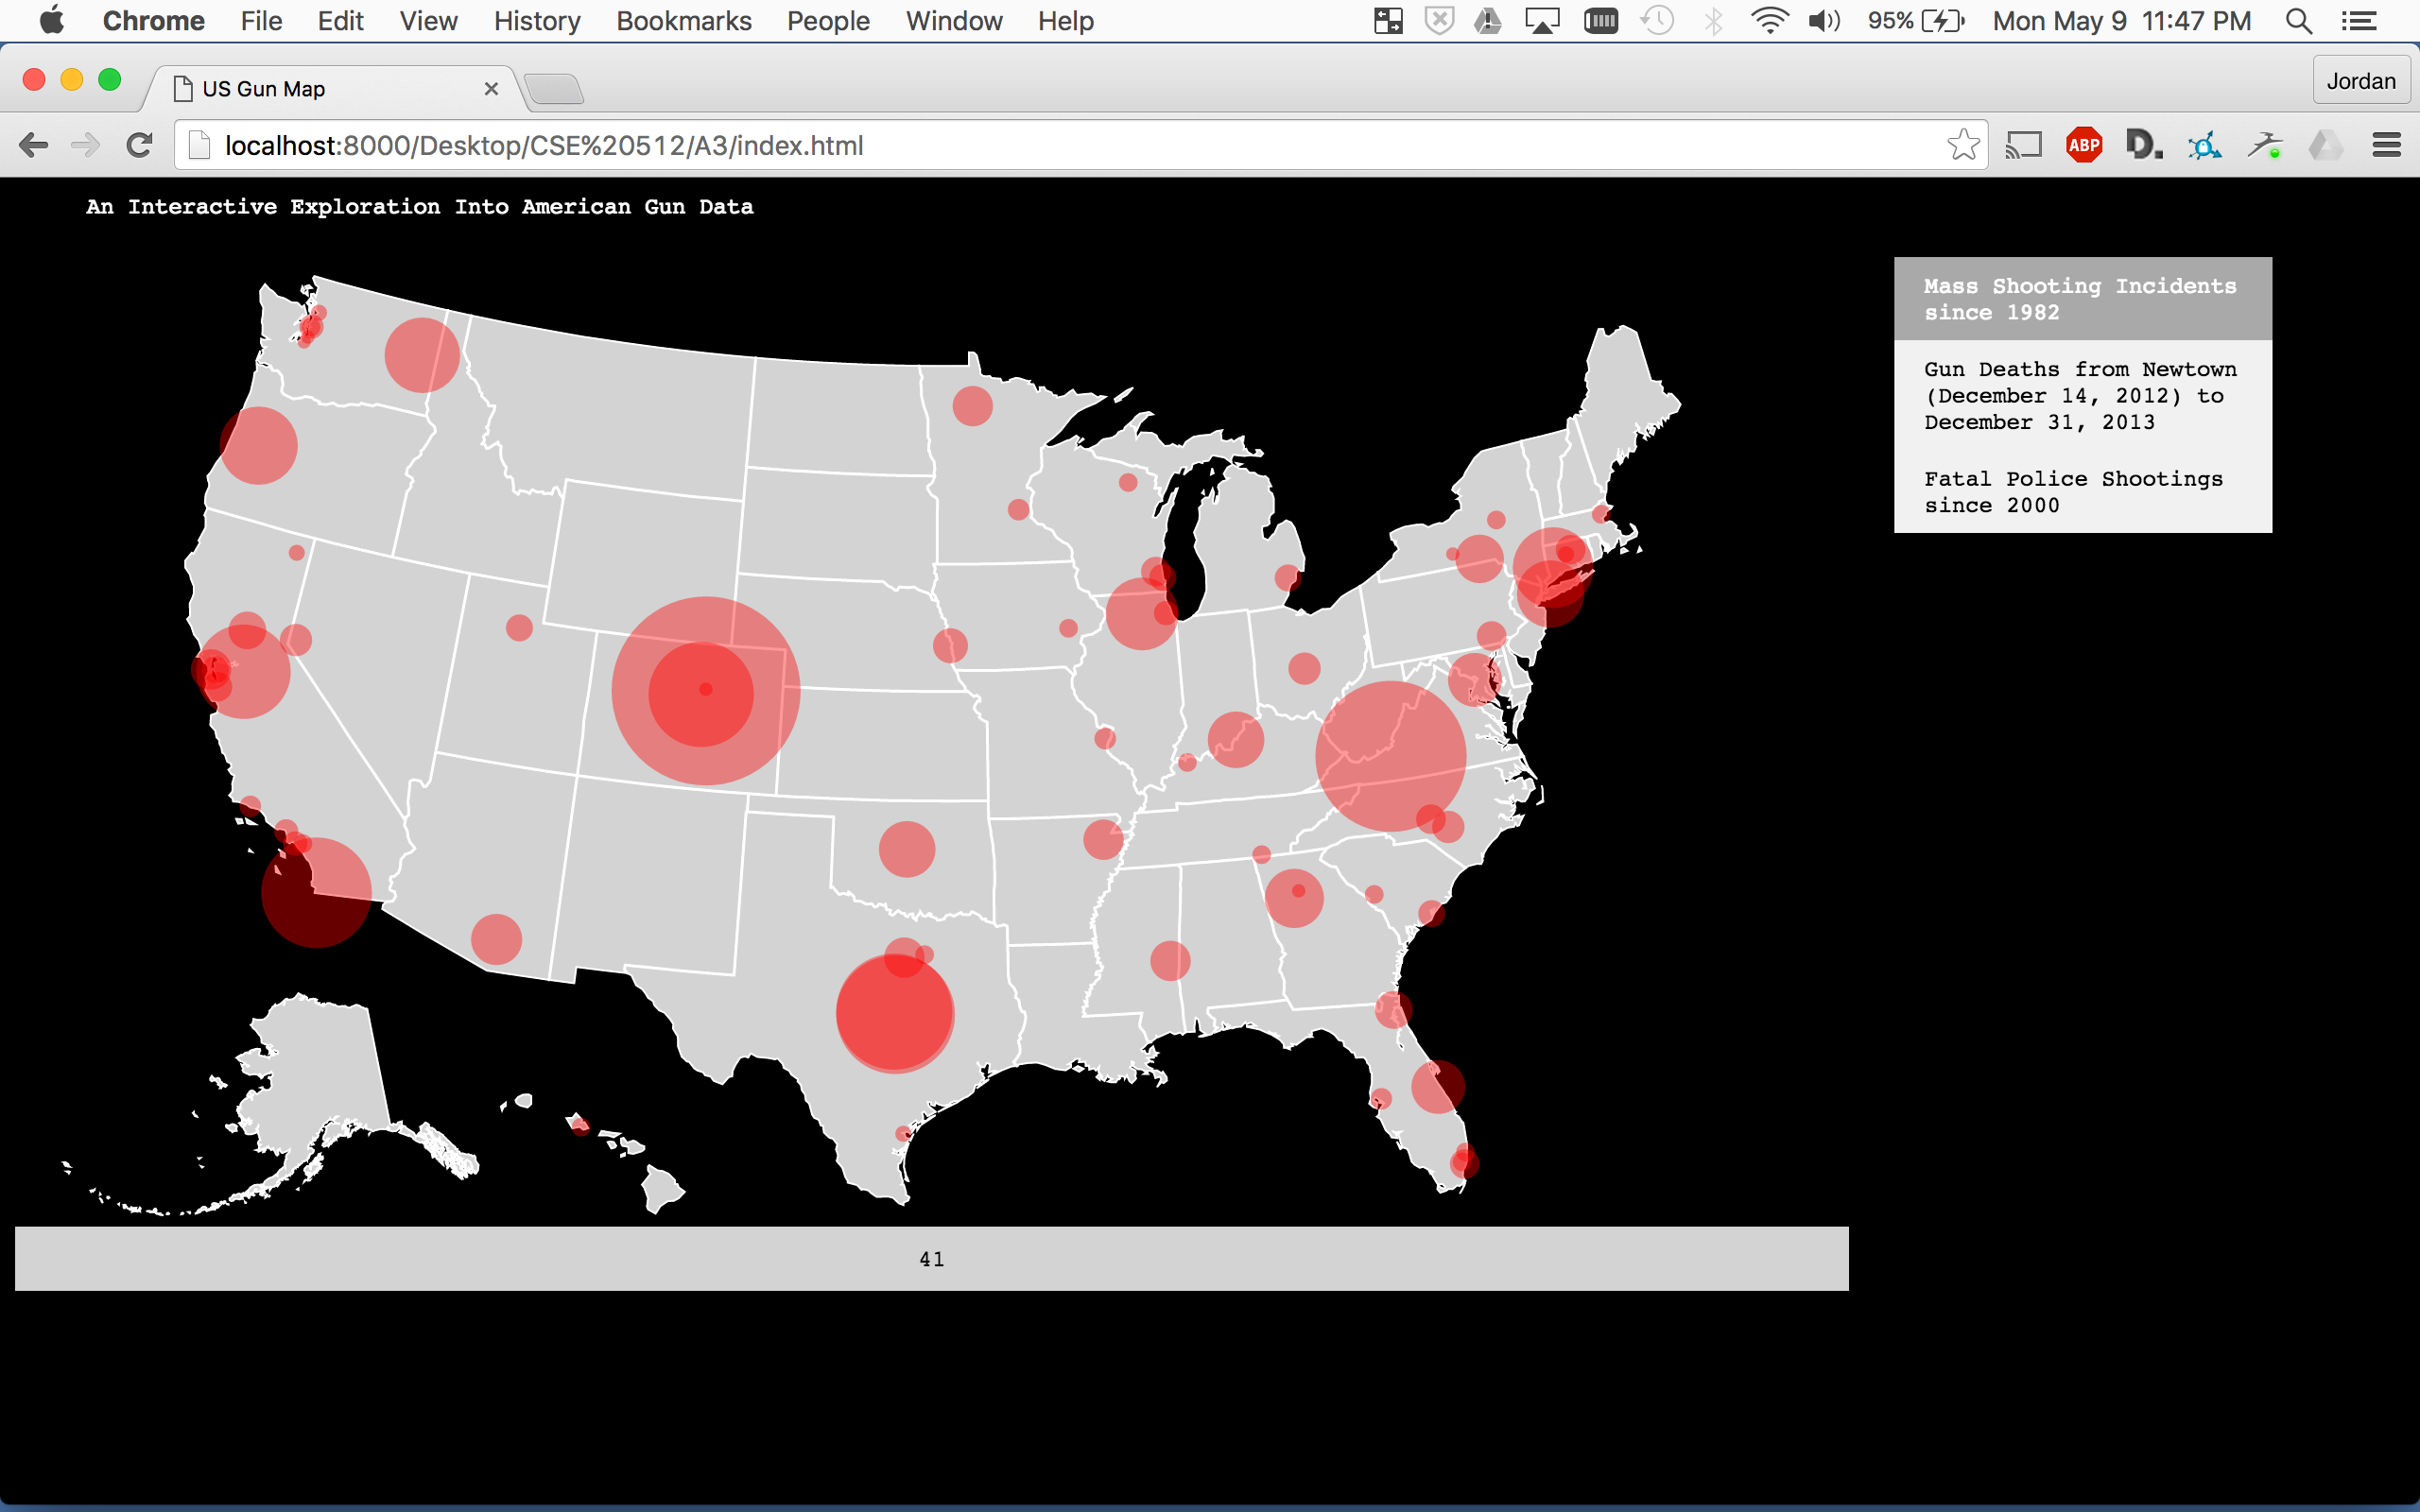
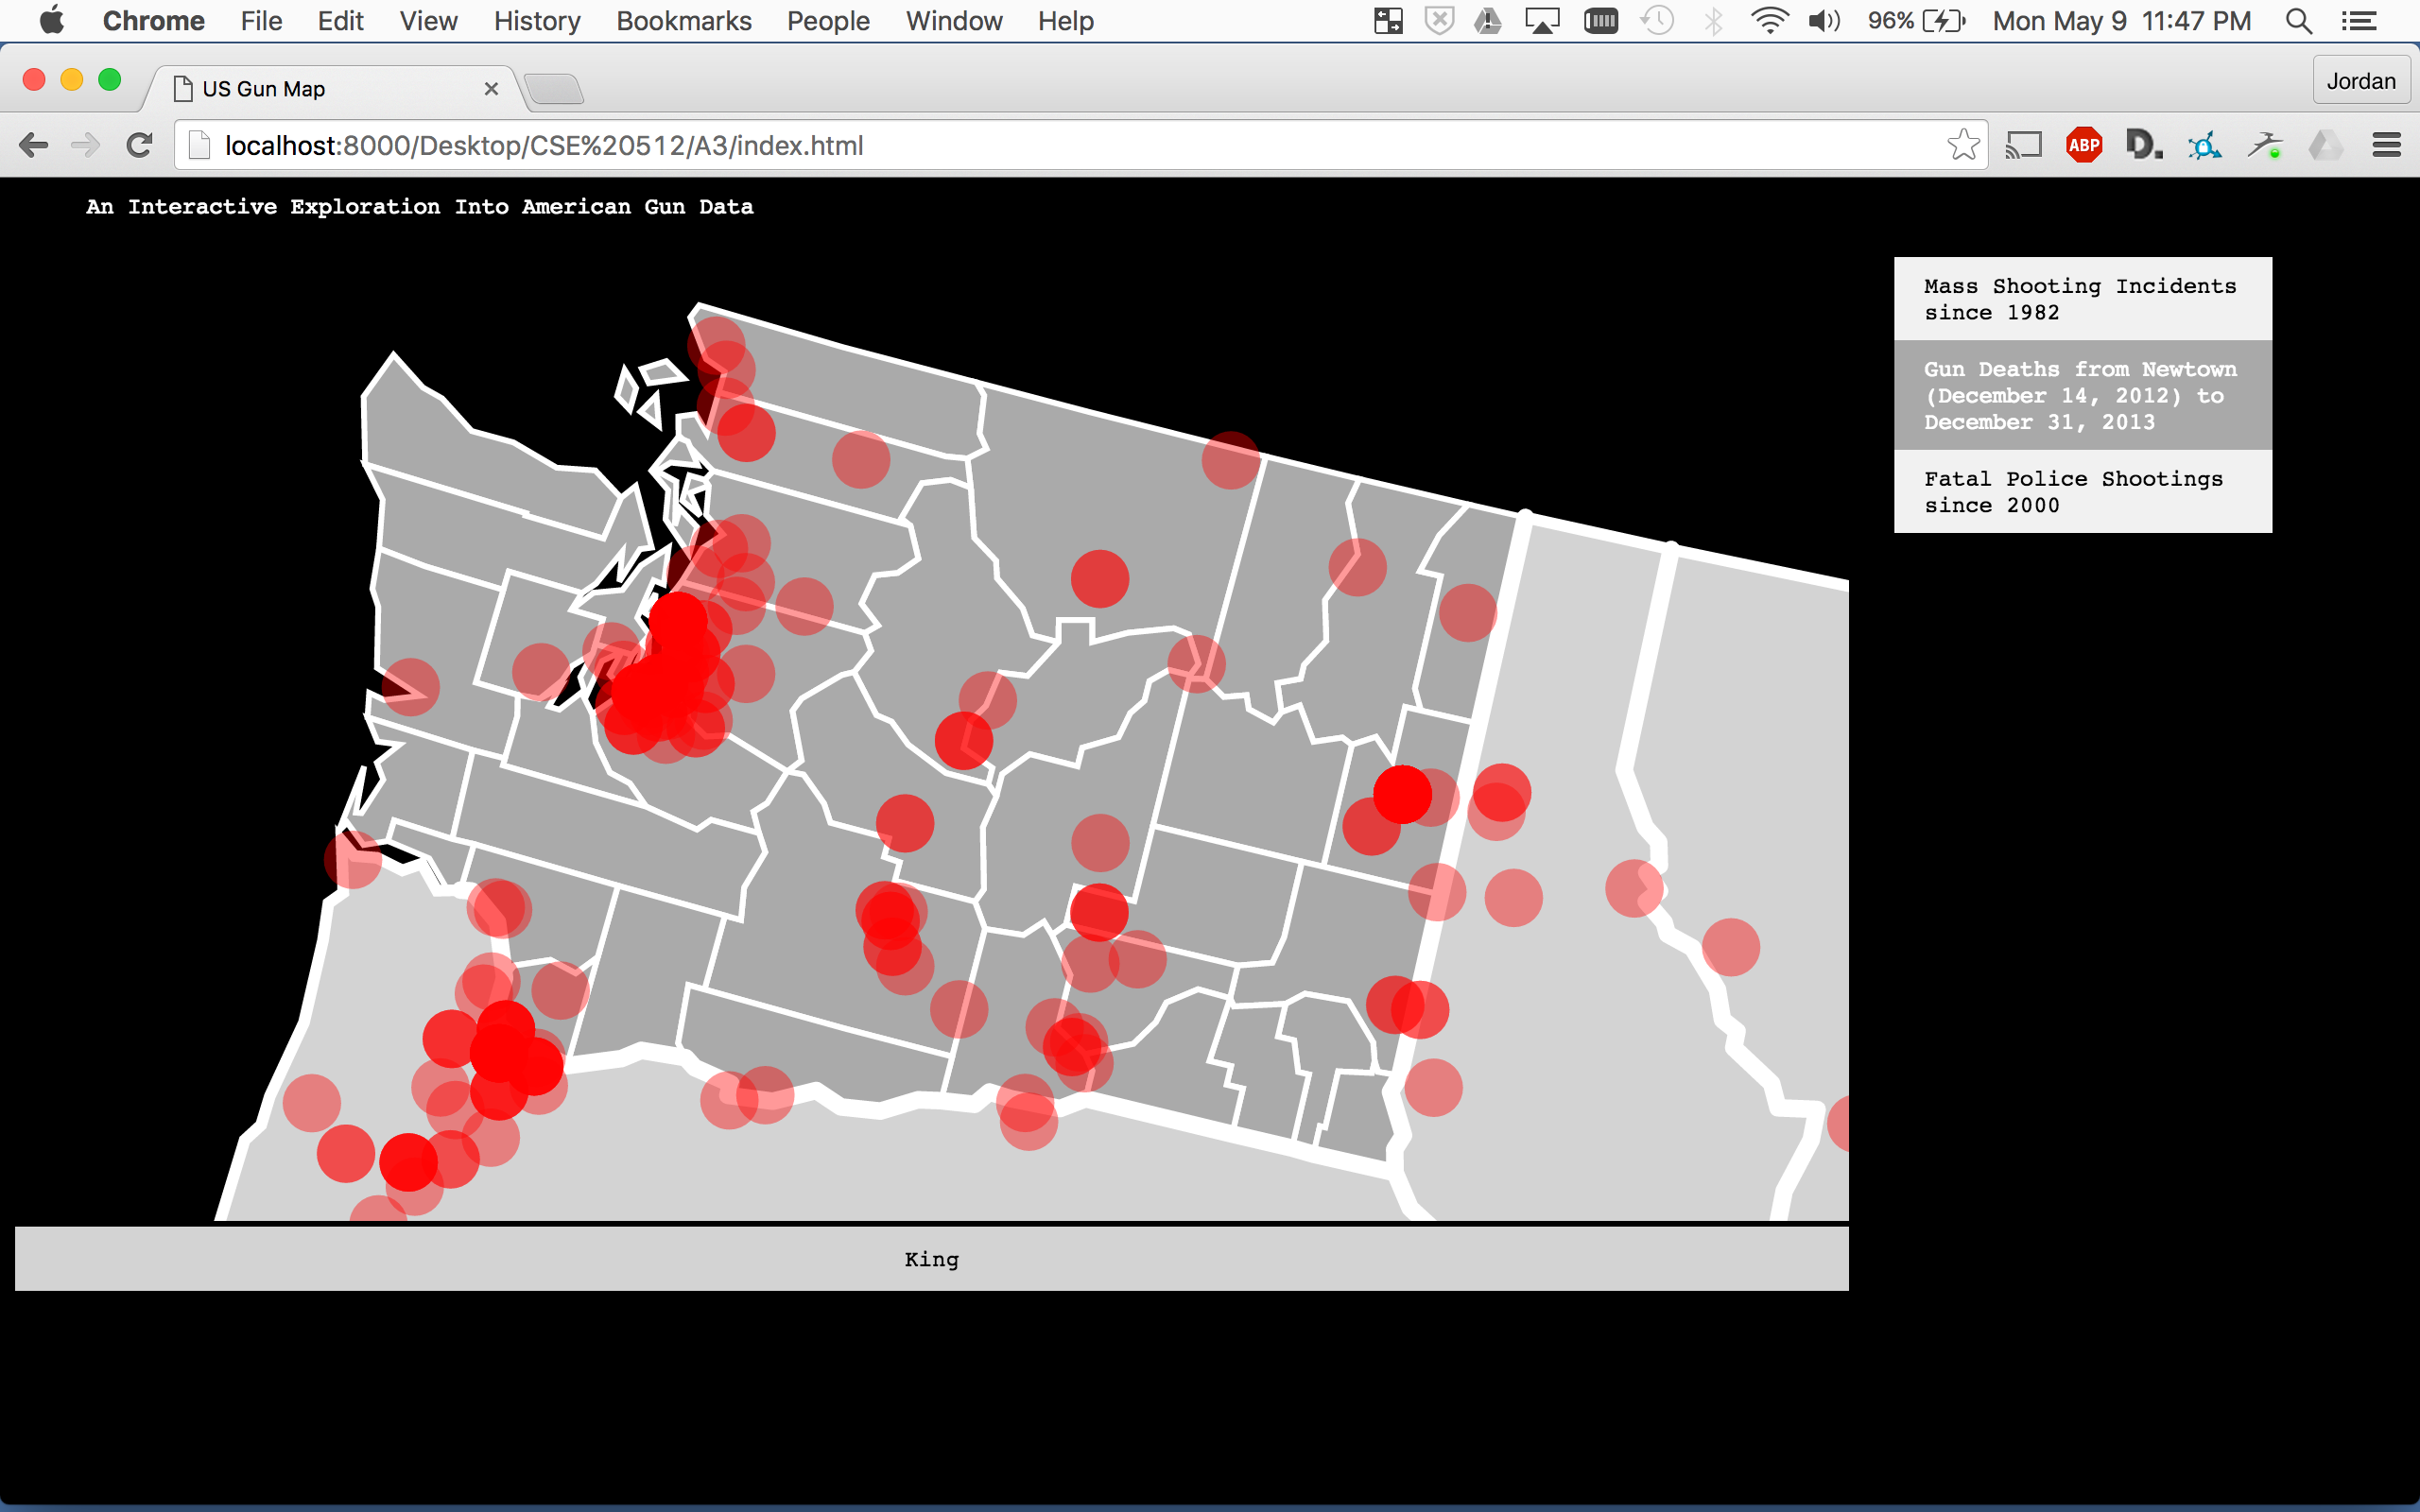
Interactivity Instructions- \br Click on state to zoom in on its counties.\br Click anywhere in state to zoom out. \br Click on any descirption from the menu to reveal a new map.
Data Collection (10 hrs): Pulled and combined data from various sources including: http://www.fatalencounters.org/ - http://www.slate.com/articles/news_and_politics/crime/2012/12/gun_death_tally_every_american_gun_death_since_newtown_sandy_hook_shooting.html - http://www.motherjones.com/politics/2012/12/mass-shootings-mother-jones-full-data - https://github.com/NYTimes/gunsales - http://www.gunviolencearchive.org/ This process was close to the most lengthly because of the lack of any national databases exists for gun deaths. The gaps in the data are everywhere. The NRA has consistenly opposed a database of gun owners in the US. Until recently, the CDC’s National Violent Death Reporting System—the best database on firearm deaths available—had data from only 18 states. Collecting the data is expensive, and states report it voluntarily. Because of this issue, I collaborated with UW epidemiologist, Frederick Rivara, for insight in where to begin my epxloration with American gun data. He was featured in a Wired article talking about the lack of avaialble gun data in America (http://www.wired.com/2015/10/america-still-doesnt-good-data-guns/). By and far the most comprehensive database out there is the Gun Violence Archive creatd by Mark Bryant (http://www.theguardian.com/world/2016/apr/23/kentucky-gun-owner-gun-violence-archive-mark-bryant). The toruble is making any declarations of trends or correlaitons with the crowdsourced datasets. Although these projects proclaim to be as impartial and data-driven as possible, do view the data with skepticism. Counting "mass shootings" is notoriously complicated and contested, since there is no standard definition of what they are. Is it best to count shootings that injure or kill a certain number of people? Or should the definition focus more narrowly on attacks in which the motivation of the shooter "appears to be indiscriminate killing"? The constraints used for the mass shooting spree data are: 4 or more victims, not related to armed robbery, gang-violence, or house invasions. Including these factors wouldve lead to many many many more data points.
Coding: Leanred d3 as I went along with my constant debugging. Many late nights. Map (10 hrs): Used https://bl.ocks.org/mbostock/4122298 as a template to mesh state borders over the US-Atlas Repositories TopoJSON file containing counties and states with their respected Ids. Zoom feature to expand into conuties (10 hrs): Plotting mass shooting incidents and gun related fatalities (5 hrs): Choropleth map of police shooting incidents (8 hrs): Tooltip showing respected visulizaiotn info (4 hrs): Combined fatality and name information for respected state/county or spree incident/victim into a tooltip that activated on hover event. CSS/HTML Styling and Layout (3 hrs): Styling and layout to make a clear and concise user interface. Interactions are minimal, what is important is expressing the data concisely and easily for easy interpretation
ReadMe (4 hrs): I wrote alot. I had zero experience with Github previously.
You can find our interactive visualization by clicking the following this link: https://cse512-16s.github.io/a3-jstarkey/ Or download the source files: cd to the project directory type in python -m SimpleHTTPServer 8888 & in your terminal open your browser and type in http://localhost:8888/index.html
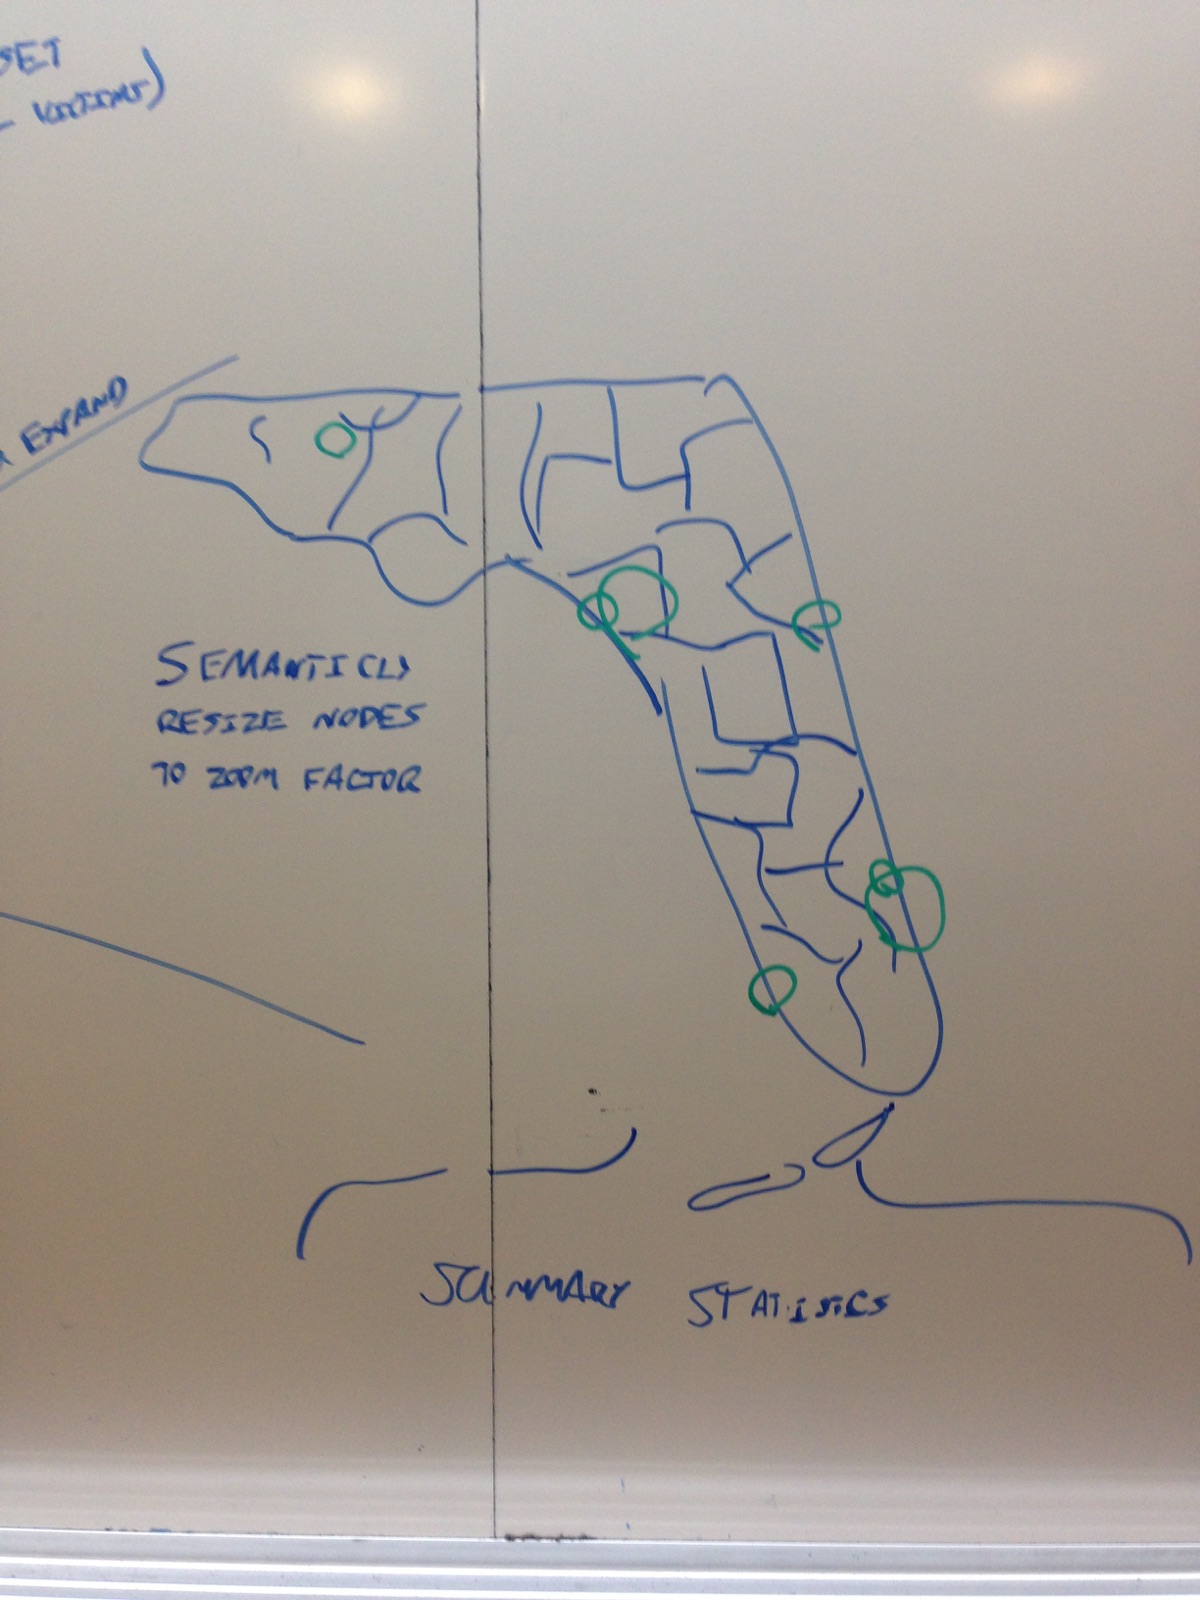
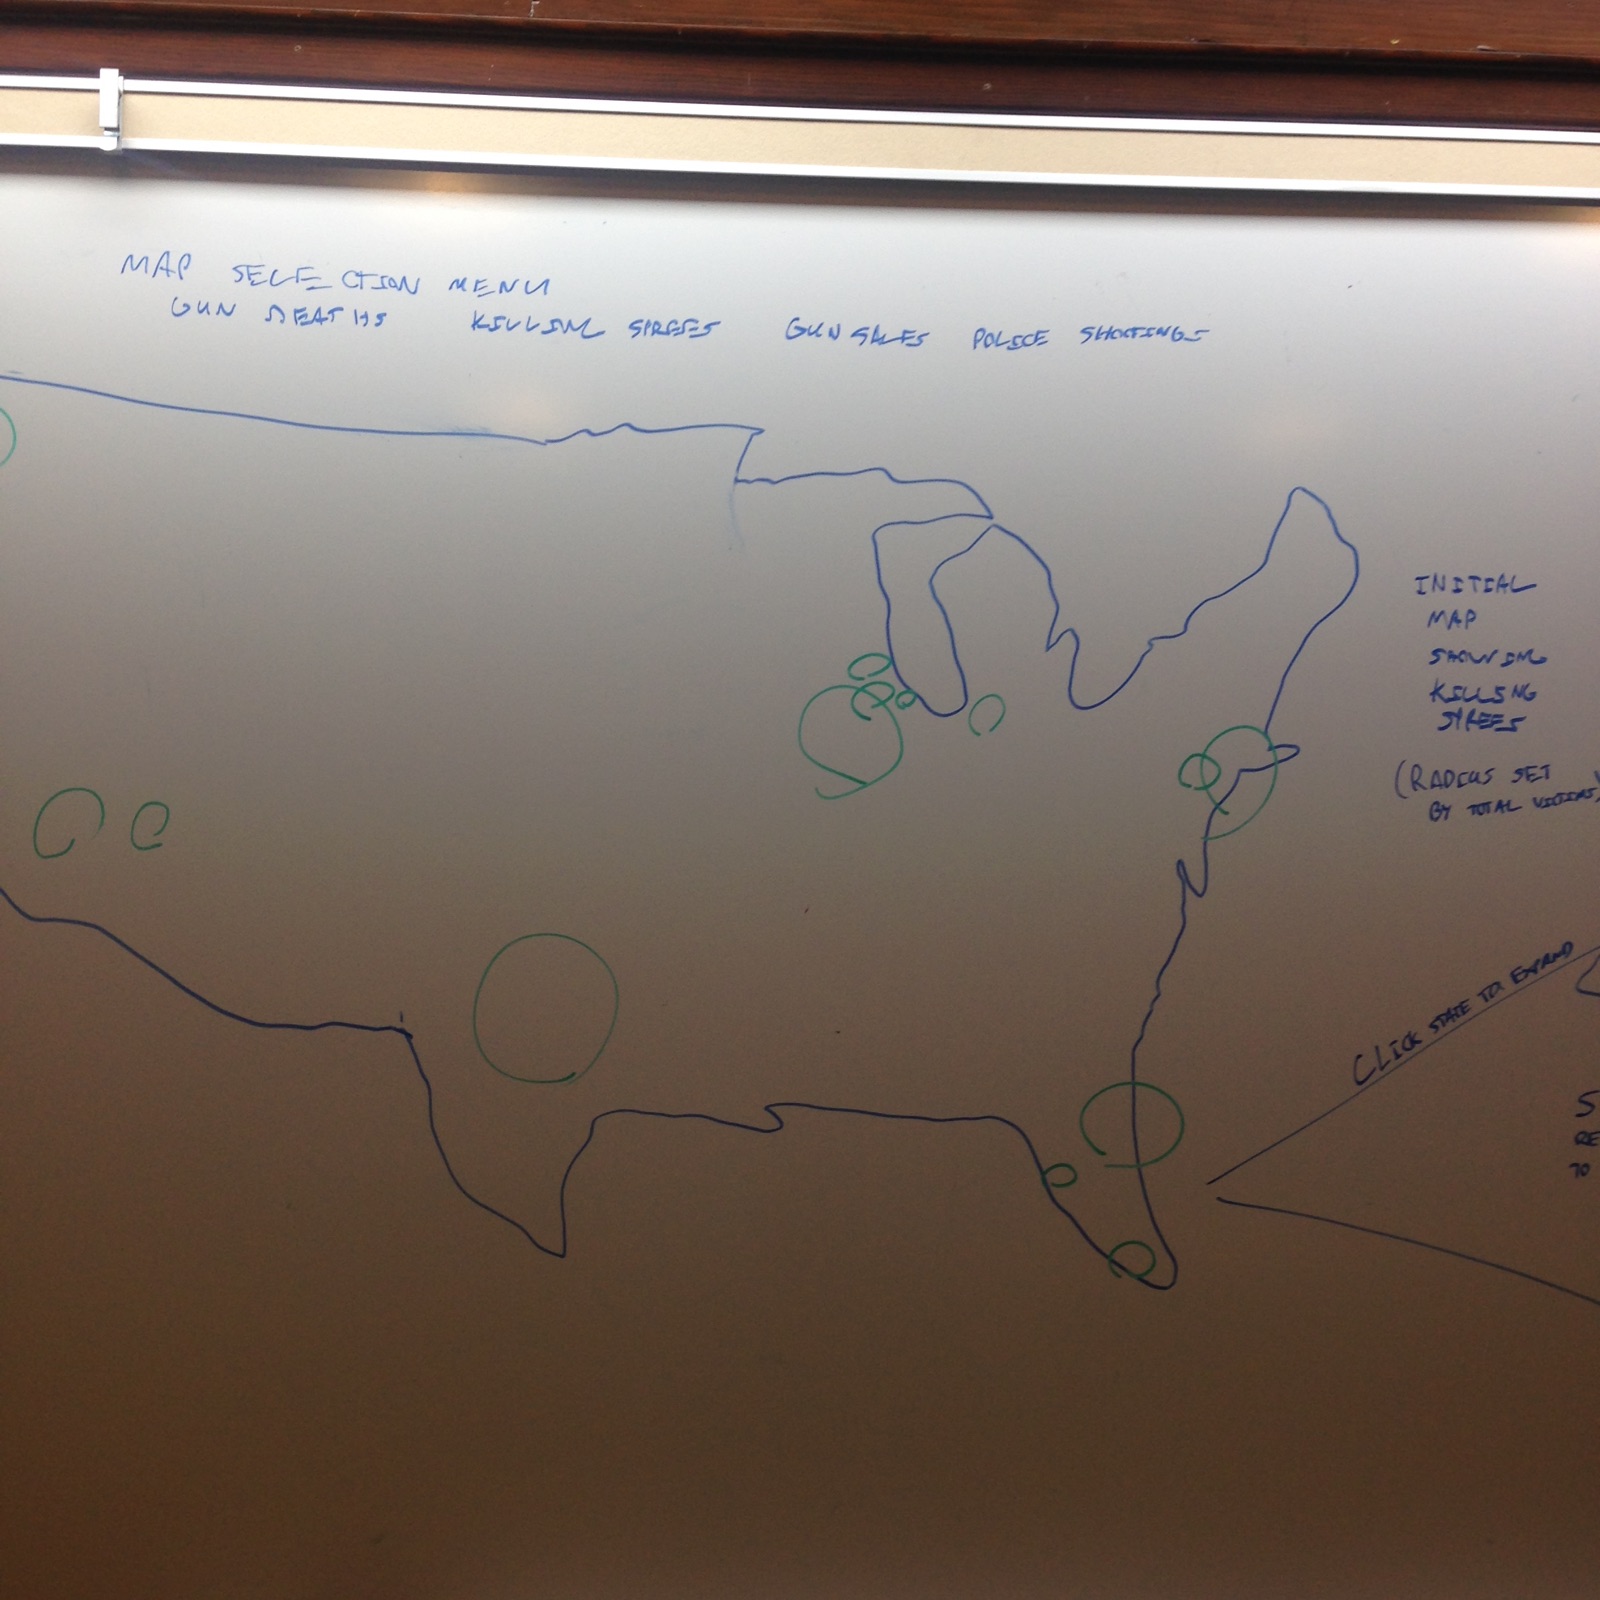
The only modificaiton I made was to bring the horizontal menu bar to the right of the map vertically. I want to include more map options as I conglomerate more data. As you can see, I wasnt able to implement the summary statistics container that would display after you zoom into a state. I would like this to show longitudinal data of each respected map type. For example, I have data from the NICS of firearm background checks that can be used to correlate firearm sales with backgorund checks dating back to 2000. I also want to introduce my data using a timeline slider and animation. For example, my data of mass killing sprees goes back to 1982, it would be nice to show this data as a filter of the slider positions set for the year of the data. This could reveal an increase in frequency of killing sprees as the time progresses.