| id | title |
|---|---|
trace-viewer |
Trace Viewer |
Playwright Trace Viewer is a GUI tool that helps you explore recorded Playwright traces after the script has ran. You can open traces locally or in your browser on trace.playwright.dev.
You can open the saved trace using Playwright CLI or in your browser on trace.playwright.dev.
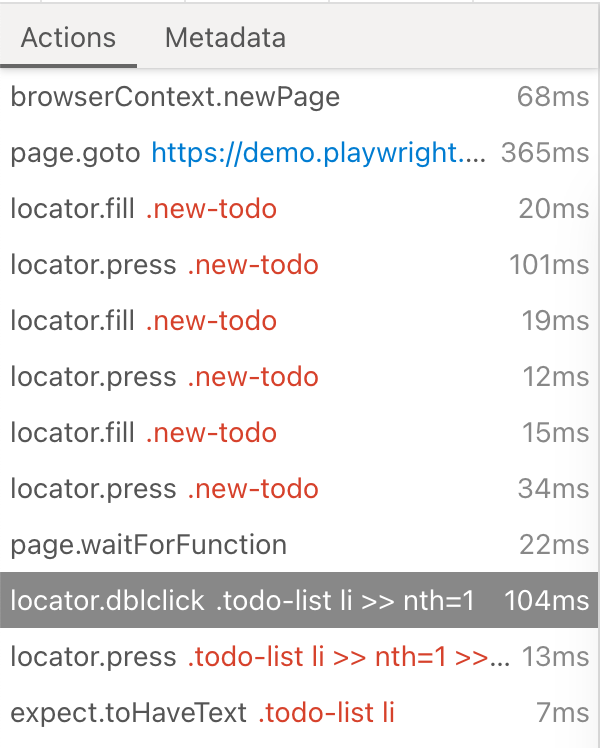
npx playwright show-trace trace.zipmvn exec:java -e -Dexec.mainClass=com.microsoft.playwright.CLI -Dexec.args="show-trace trace.zip"playwright show-trace trace.zippwsh bin/Debug/netX/playwright.ps1 show-trace trace.zipOnce trace is opened, you will see the list of actions Playwright performed on the left hand side:
Selecting each action reveals:
- action snapshots,
- action log,
- source code location,
- network log for this action
In the properties pane you will also see rendered DOM snapshots associated with each action.
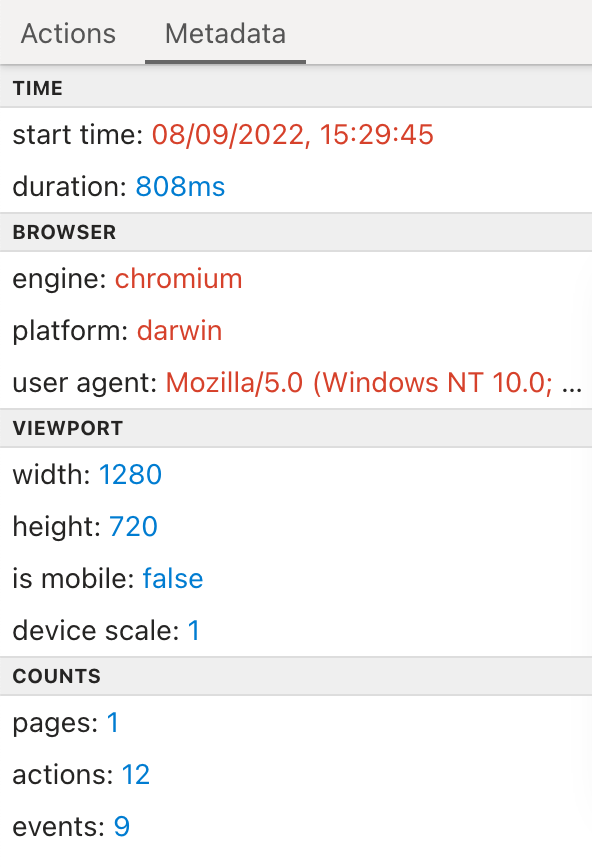
See metadata such as the time the action was performed, what browser engine was used, what the viewport was and if it was mobile and how many pages, actions and events were recorded.
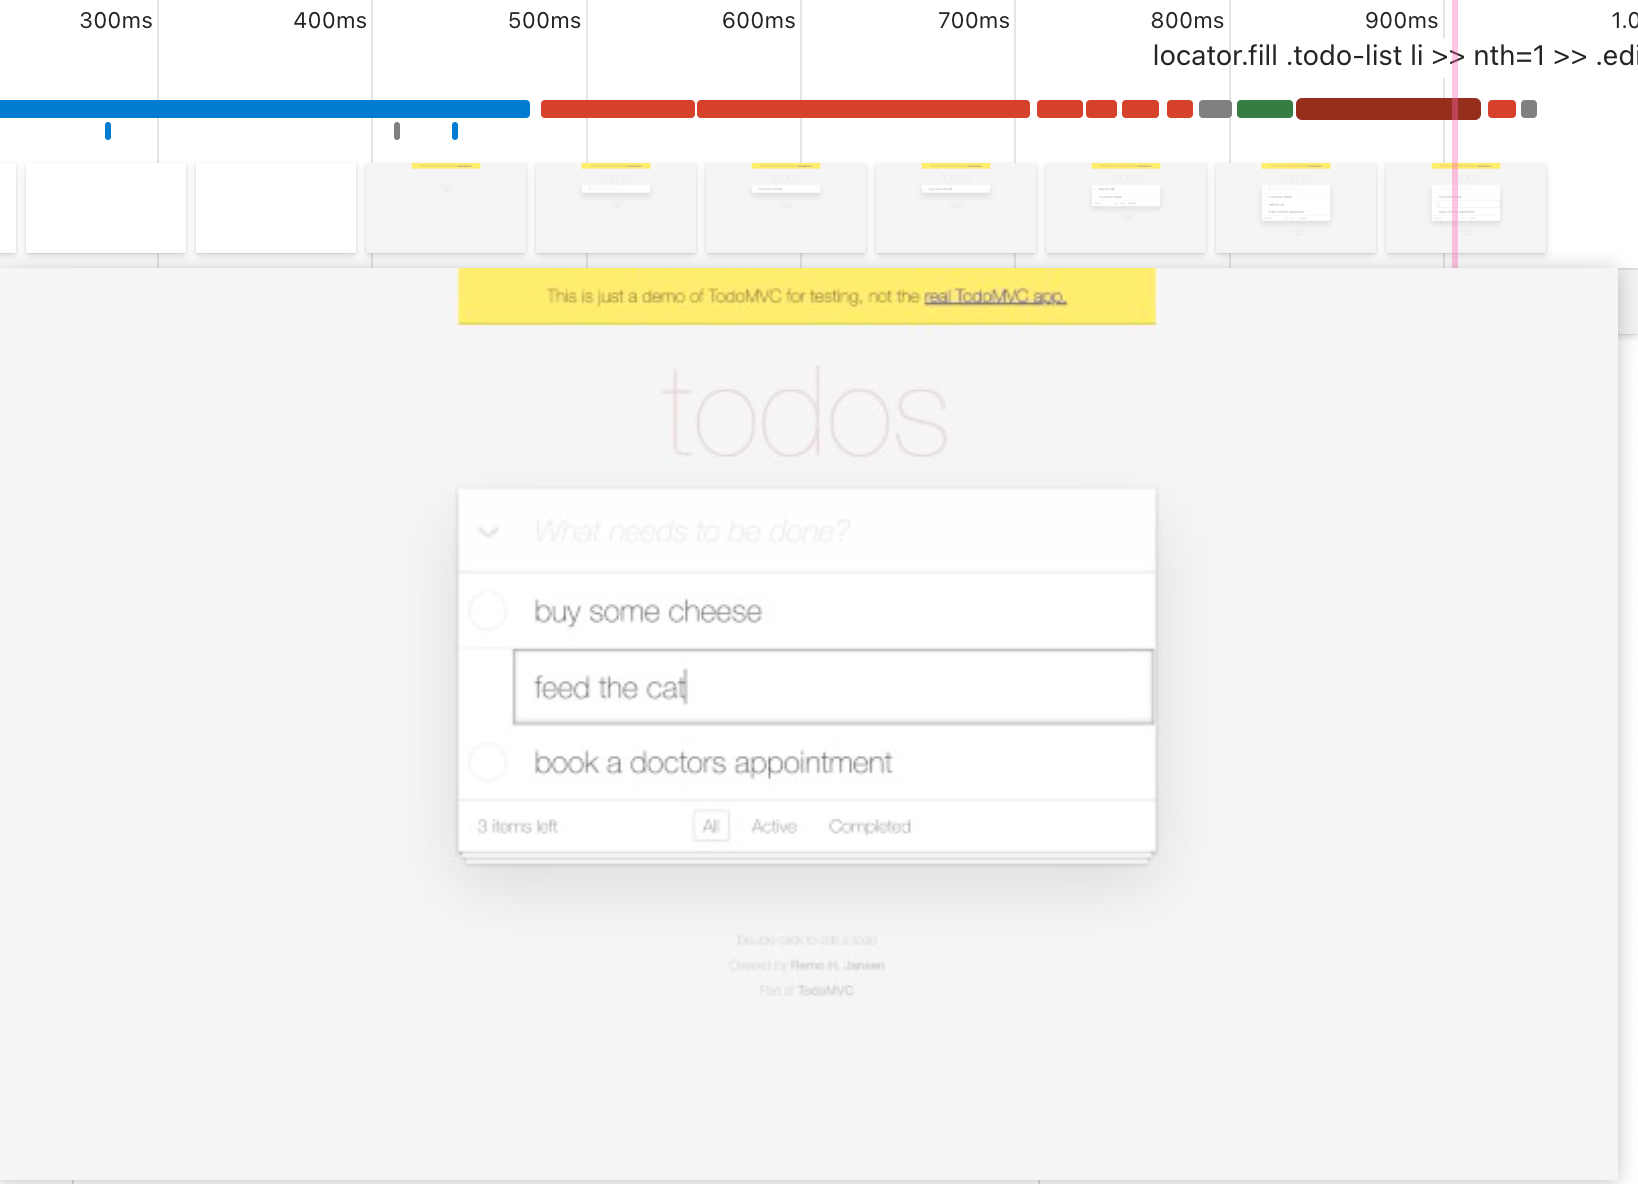
When tracing with the [option: screenshots] option turned on, each trace records a screencast and renders it as a film strip:
You can hover over the film strip to see a magnified image of for each action and state which helps you easily find the action you want to inspect.
When tracing with the [option: snapshots] option turned on, Playwright captures a set of complete DOM snapshots for each action. Depending on the type of the action, it will capture:
| Type | Description |
|---|---|
| Before | A snapshot at the time action is called. |
| Action | A snapshot at the moment of the performed input. This type of snapshot is especially useful when exploring where exactly Playwright clicked. |
| After | A snapshot after the action. |
Here is what the typical Action snapshot looks like:
https://user-images.githubusercontent.com/13063165/189153245-0bdcad4d-16a3-4a71-90d8-71a8038c0720.png" />Notice how it highlights both, the DOM Node as well as the exact click position.
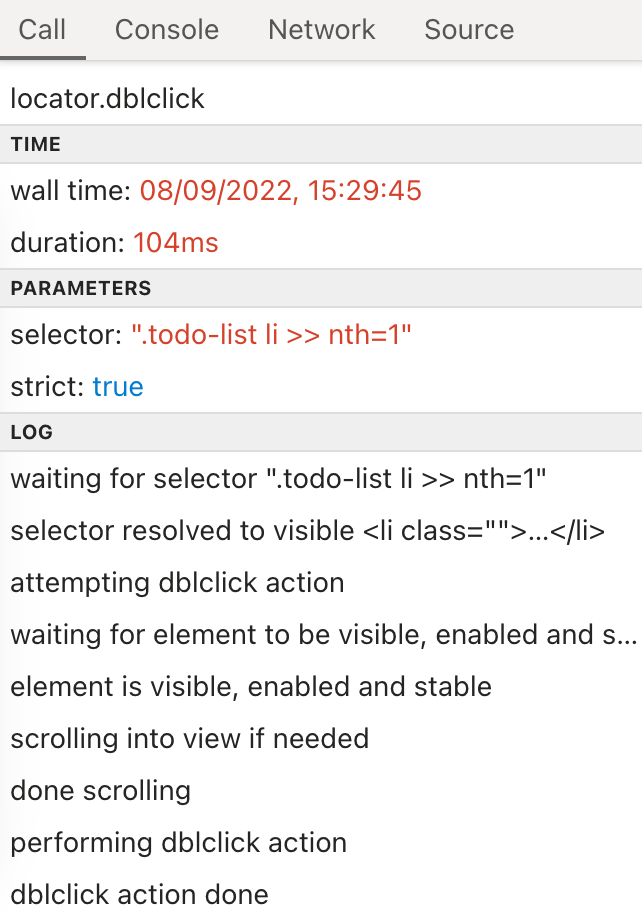
See what action was called, the time and duration as well as parameters, return value and log.
See the console output for the action where you can see console logs or errors.
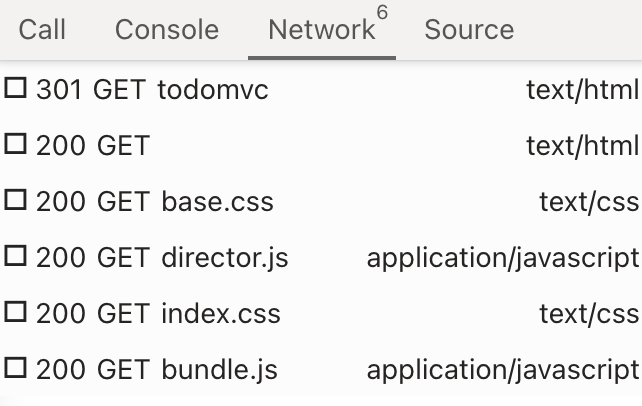
See any network requests that were made during the action.
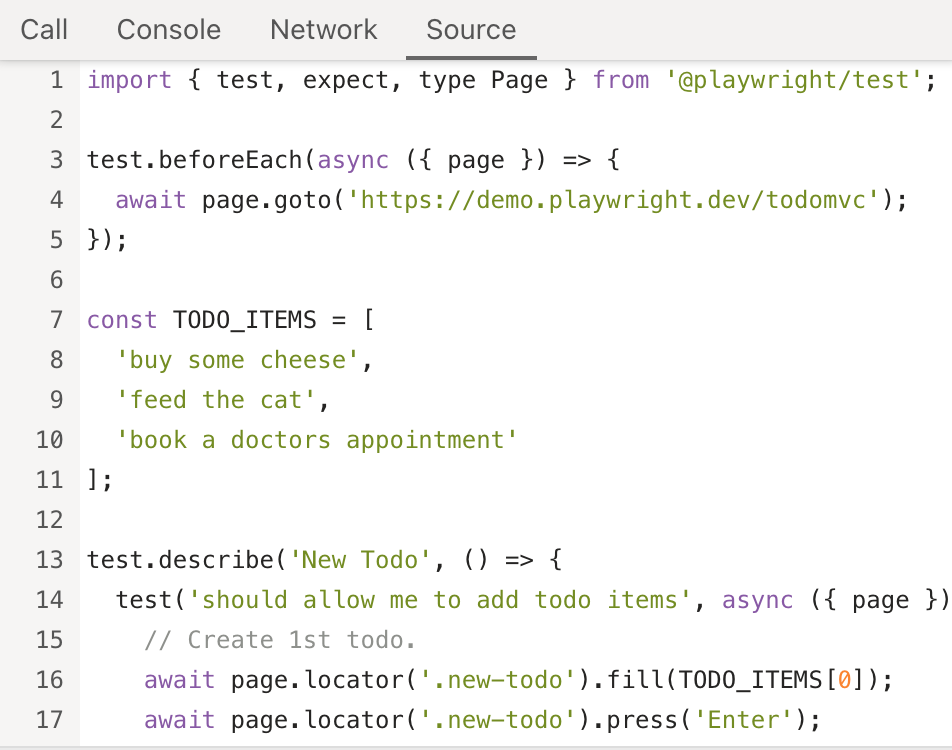
See the source code for your entire test.
- langs: js
To record a trace during development mode set the --trace flag to on when running your tests.
npx playwright test --trace onYou can then open the HTML report and click on the trace icon to open the trace.
npx playwright show-reportTraces should be run on continuous integration on the first retry of a failed test
by setting the trace: 'on-first-retry' option in the test configuration file. This will produce a trace.zip file for each test that was retried.
// @ts-check

/** @type {import('@playwright/test').PlaywrightTestConfig} */
const config = {
  retries: 1,
  use: {
    trace: 'on-first-retry',
  },
};

module.exports = config;
import type { PlaywrightTestConfig } from '@playwright/test';
const config: PlaywrightTestConfig = {
retries: 1,
use: {
trace: 'on-first-retry',
},
};
export default config;const browser = await chromium.launch();
const context = await browser.newContext();
// Start tracing before creating / navigating a page.
await context.tracing.start({ screenshots: true, snapshots: true });
const page = await context.newPage();
await page.goto('https://playwright.dev');
// Stop tracing and export it into a zip archive.
await context.tracing.stop({ path: 'trace.zip' });Available options to record a trace:
'on-first-retry'- Record a trace only when retrying a test for the first time.'off'- Do not record a trace.'on'- Record a trace for each test. (not recommended as it's performance heavy)'retain-on-failure'- Record a trace for each test, but remove it from successful test runs.
You can also use trace: 'retain-on-failure' if you do not enable retries but still want traces for failed tests.
If you are not using Playwright as a Test Runner, use the [property: BrowserContext.tracing] API instead.
- langs: java, csharp, python
Traces can be recorded using the [property: BrowserContext.tracing] API as follows:
Browser browser = browserType.launch();
BrowserContext context = browser.newContext();

// Start tracing before creating / navigating a page.
context.tracing().start(new Tracing.StartOptions()
  .setScreenshots(true)
  .setSnapshots(true)
  .setSources(true));

Page page = context.newPage();
page.navigate("https://playwright.dev");

// Stop tracing and export it into a zip archive.
context.tracing().stop(new Tracing.StopOptions()
  .setPath(Paths.get("trace.zip")));
browser = await chromium.launch()
context = await browser.new_context()
# Start tracing before creating / navigating a page.
await context.tracing.start(screenshots=True, snapshots=True, sources=True)
await page.goto("https://playwright.dev")
# Stop tracing and export it into a zip archive.
await context.tracing.stop(path = "trace.zip")browser = chromium.launch()
context = browser.new_context()
# Start tracing before creating / navigating a page.
context.tracing.start(screenshots=True, snapshots=True, sources=True)
page.goto("https://playwright.dev")
# Stop tracing and export it into a zip archive.
context.tracing.stop(path = "trace.zip")await using var browser = playwright.Chromium.LaunchAsync();
await using var context = await browser.NewContextAsync();
// Start tracing before creating / navigating a page.
await context.Tracing.StartAsync(new()
{
Screenshots = true,
Snapshots = true,
Sources = true
});
var page = context.NewPageAsync();
await page.GotoAsync("https://playwright.dev");
// Stop tracing and export it into a zip archive.
await context.Tracing.StopAsync(new()
{
Path = "trace.zip"
});This will record the trace and place it into the file named trace.zip.
You can open the saved trace using Playwright CLI or in your browser on trace.playwright.dev.
npx playwright show-trace trace.zipmvn exec:java -e -Dexec.mainClass=com.microsoft.playwright.CLI -Dexec.args="show-trace trace.zip"playwright show-trace trace.zippwsh bin/Debug/netX/playwright.ps1 show-trace trace.zipUsing trace.playwright.dev
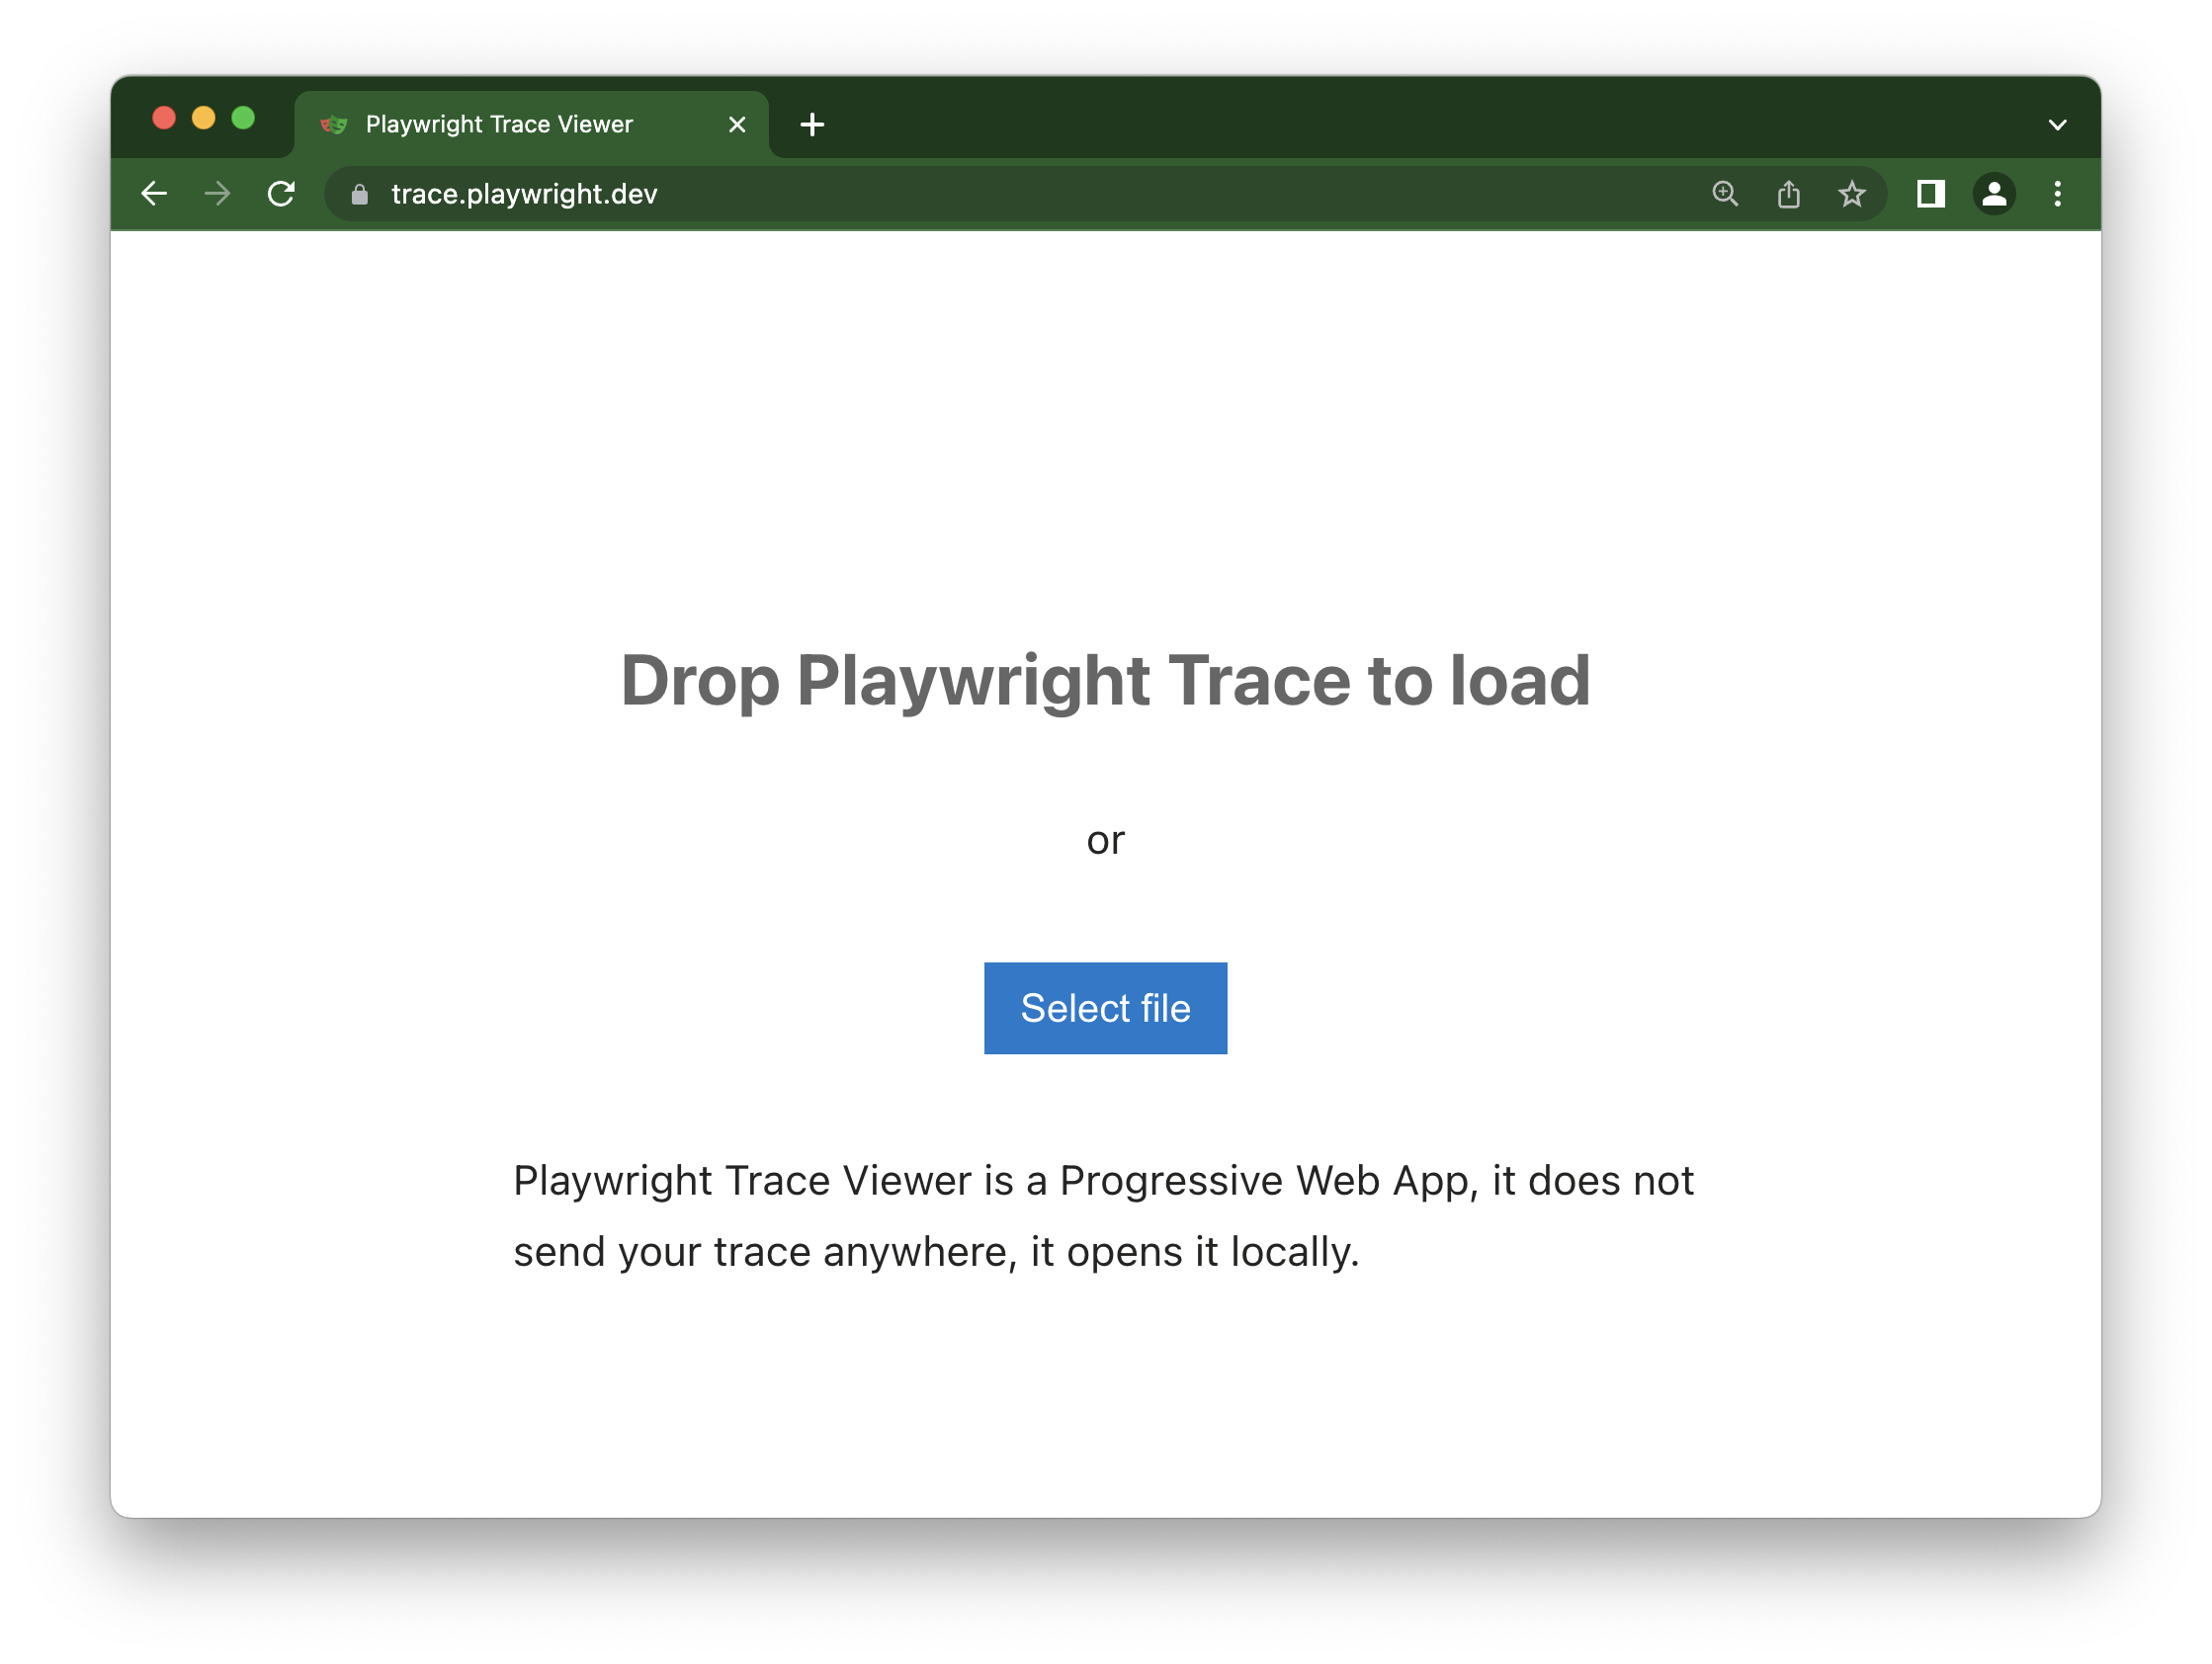
trace.playwright.dev is a statically hosted variant of the Trace Viewer. You can upload trace files using drag and drop.
You can open remote traces using it's URL. They could be generated on a CI run which makes it easy to view the remote trace without having to manually download the file.
npx playwright show-trace https://example.com/trace.zipmvn exec:java -e -Dexec.mainClass=com.microsoft.playwright.CLI -Dexec.args="show-trace https://example.com/trace.zip"playwright show-trace https://example.com/trace.zippwsh bin/Debug/netX/playwright.ps1 show-trace https://example.com/trace.zipYou can also pass the URL of your uploaded trace (e.g. inside your CI) from some accessible storage as a parameter. CORS (Cross-Origin Resource Sharing) rules might apply.
https://trace.playwright.dev/?trace=https://demo.playwright.dev/reports/todomvc/data/cb0fa77ebd9487a5c899f3ae65a7ffdbac681182.zip