Ephemeral messages produce 100% one core CPU usage #10760
Comments
|
Just have tested - this is true for web version also. |
|
4 week messages do not produce 100% usage, but rather 20% per each message, And the more ephemeral messages in chat there are, the higher CPU usage gets. |
|
Same problem here... true for Mac OS X (very high CPU Load for "Wire Helper"), iPhone and iOS (App crashes). I like to chat with a default of 1h message lifetime. After some messages (50+ over the day) iPhone and IOS Apps starts to crash (can be reopened). If you carry on messaging... you have to reopen the App two or more times. (not the best) workaround: I delete the content of the chat... App acts normal for a bunch of time (half a day)... then same problem occurs again (after continuing using 1h messages). |
|
Thanks. As stated we have fixed this internally already and hope to get this out to you all soon. |
|
The release was pushed to production this morning. Please quite and restart your desktop app and ensure that you are running webapp version 2018.08.06.0803 which contains the fix. |
|
@gregor please, reopen this issue, since it is not fixed. If there are no ephemeral messages in currently open chat in wire app, wire-desktop takes ~0.3% CPU. But if there is at least one message, that would last, say, 1 day, CPU usage is constantly above 20%. And the more ephemeral messages there are, the bigger it gets. For intance, with 20 messages CPU isage is around 35%. Idle chat app window should never take that much CPU. This is really bad for battery life. Using Wire for Web 2018.08.06.0803 |
|
BTW, just tested the same in Signal desktop. There are animations, but most of the time signal-desktop uses around 0% CPU, even with multiple ephemeral messages lasting 1 day. It gets around ~3% with ten messages with 1 minute limit. |
|
Possibly related: svgs with animations, even if hidden inside of several layers of |
|
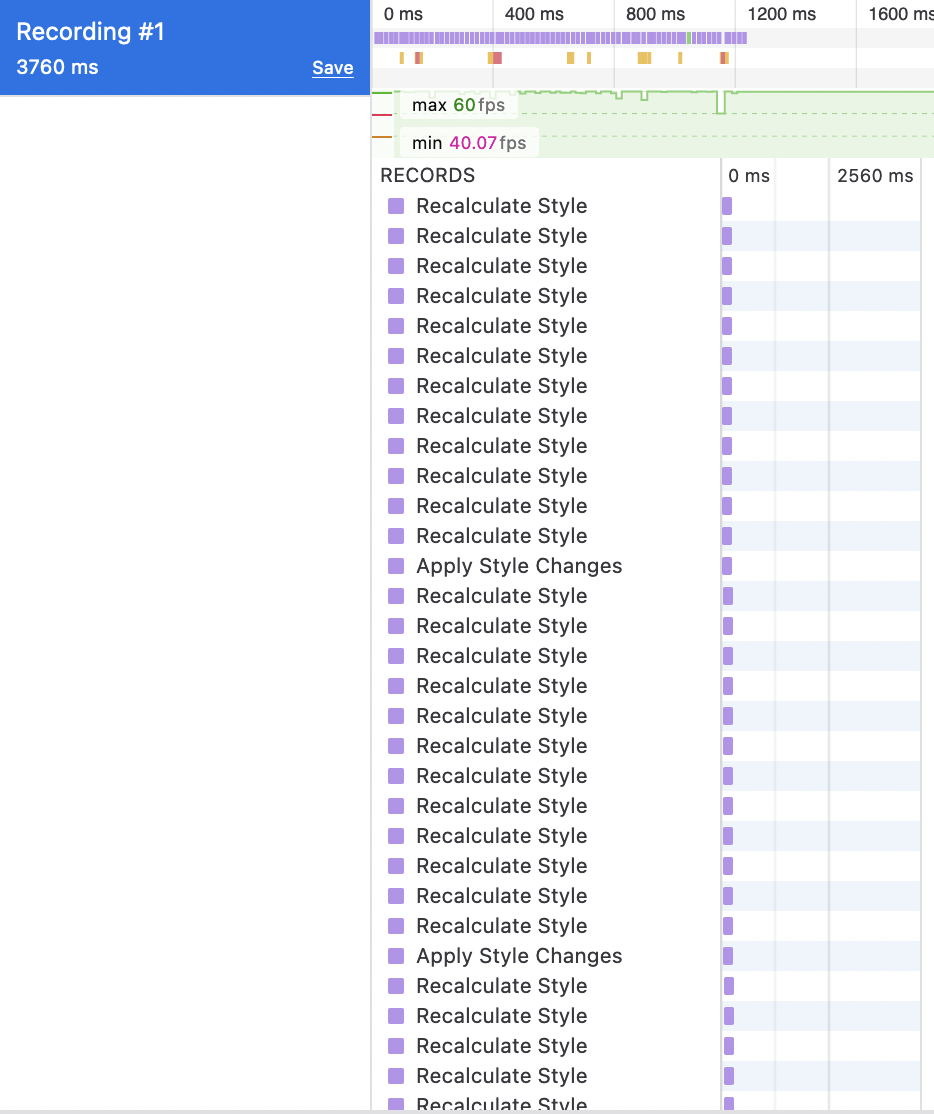
In line with this as well, with ephemeral messages wire is constantly recalculating the stylesheet (hundreds of times per second). An hour long chat with two people having 1 day long expiration timers shows this behavior... not sure of the power or CPU impact but I'm guessing that recalculating the stylesheet hundreds of times per second to run the dial animations is not good.
Adding this: Now all the stylesheet recalcs are gone:
And it resembles what is seen in an empty chat:
There are probably better approaches for doing these dials rather than having a thousand SVGs with attached CSS animations. A possible implementation would be to just prerender 30 or 60 positions of the dial into a sprite and just grab from the sprite. Granularity wise I am not sure that just saying 40 steps on these animations does what one would hope at face value (i.e. hope it will just animate it 40 times over the length of a 1 day long timer). I think it may also be rendering these at as close to 60fps as it can. Javascript and a sprite might be more efficient. Regardless, if you are talking to multiple people a day and having a few thousand messages you are ending up with a few thousand ongoing CSS animations which are not really needed to provide this functionality. One priority queue popping events and a rough granularity will I think be a better implementation. Food for thought anyway as these problems are coming up. I don't really need to know how long the message has left, but to know that the timer is on or off. So this uBlock origin rule suffices for me: That will leave a circle indicating that the message has a timer on it and will expire, but will I hope cut out the animation portions that dog the CPU. .... haven't tested extensively and it may be that this screws up writing new messages as I'm getting some keyboard input delays now [Edit: those resolved by restarting Firefox]. But, use at your own risk. |


|
Edit: for those who didn't see the previous uBlock suggestion posted it's the first line below: Add these to uBlock, restart your browser and re-log into wire. After this I am finally (after four years) getting a reasonable CPU usage while running Wire (inside Firefox so uBlock will work) and no severe downside to this. These should be very minor changes to make to Wire and hopefully the team can roll it out into the desktop app. And maybe put in a bit more effort in the future. Took the previous posters a couple of days to find the spinner and post the uBlock workaround and based on that it took me an hour to get the rest.
|

|
@dbquarrel I think you mistakenly pasted the same ublock filter twice. |
|
Thanks @liskin ... I fixed it. Apply in uBlock does work but sometimes gets dicey and Firefox started acting wierd as I was playing. I just restarted and I was seeing 2% as a low where normally FF would be hovering between 60-120% CPU use depending on the length of convo. |
|
Thanks for all your reports! We fixed the issue with this PR: #11071 |
Wire version: 3.2.2840
Wire for web version: 2018.07.26.0854
Operating system: Kubuntu 16.04 LTS, fully updated.
What steps will reproduce the problem?
This is true for both short-lived and long-lived messages (that should not have any animation whatsoever, only indicator changing once in few hours or days).
So, if you have an ephemeral message with a week lifespan in some chat, then you'll have 100% cpu usage anytime within that week that you open that chat.
The text was updated successfully, but these errors were encountered: