A number of small tools for generating and manipulating diagrams, mostly relying on Graphviz for output.
Vidar Hokstad <vidar@hokstad.com>
Unless otherwise noted, everything here is under the MIT license - see the LICENSE file.
An XSL transform to pretty up the SVG output from Graphviz; see also this update
By Vidar Hokstad and Ryan Shea; Contributions by Jonas Tingborn, Earl Cummings, Michael Kennedy (Graphviz 2.20.2 compatibility, bug fixes, testing, lots of gradients); Paul Boddie (refactoring, bug fixes)
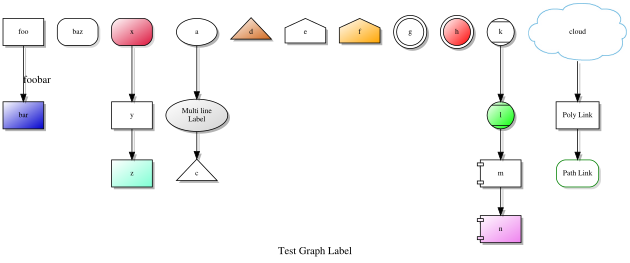
Example output:
A script by Vidar Hokstad to visualize Ruby arrays using Graphviz
A script by Vidar Hokstad to visualize traceroute ouput with Graphviz