Skip to content
New issue

Have a question about this project? Sign up for a free GitHub account to open an issue and contact its maintainers and the community.

By clicking “Sign up for GitHub”, you agree to our terms of service and privacy statement. We’ll occasionally send you account related emails.

Already on GitHub? Sign in to your account

Plotly mapbox animations no longer work in streamlit versions 1.15.0 & 1.16.0 #5881

Closed
4 of 5 tasks
georgeyoulden opened this issue Dec 22, 2022 · 4 comments
Closed
4 of 5 tasks
Labels
type:bug Something isn't working

Comments

@georgeyoulden
Copy link

georgeyoulden commented Dec 22, 2022

Checklist

  • I have searched the existing issues for similar issues.
  • I added a very descriptive title to this issue.
  • I have provided sufficient information below to help reproduce this issue.

Summary

When trying to display an animated plotly "scatter_mapbox" figure, the chart is frozen on the first frame even though the slider is moving. Dragging the slider also does not change the visual. This was previously working in streamlit version 1.14.0.

Reproducible Code Example

import streamlit as st
import plotly_express as px

px.set_mapbox_access_token(open(".mapbox_token").read())
df=px.data.carshare()
df=df.sort_values('peak_hour')
fig=px.scatter_mapbox(df, lon='centroid_lon', lat='centroid_lat', size='car_hours', animation_frame='peak_hour', height=600)
st.plotly_chart(fig, use_container_width=True)

Steps To Reproduce

  1. Get mapbox token and save in file ".mapbox_token"
  2. Run code provided.
  3. Live version shown here: https://georgeyoulden-mapboxtest-mapbox-test-3qsr9x.streamlit.app/

Expected Behavior

An animated map, with moving centroids of different sizes.

Current Behavior

Plot showing first frame
newplot
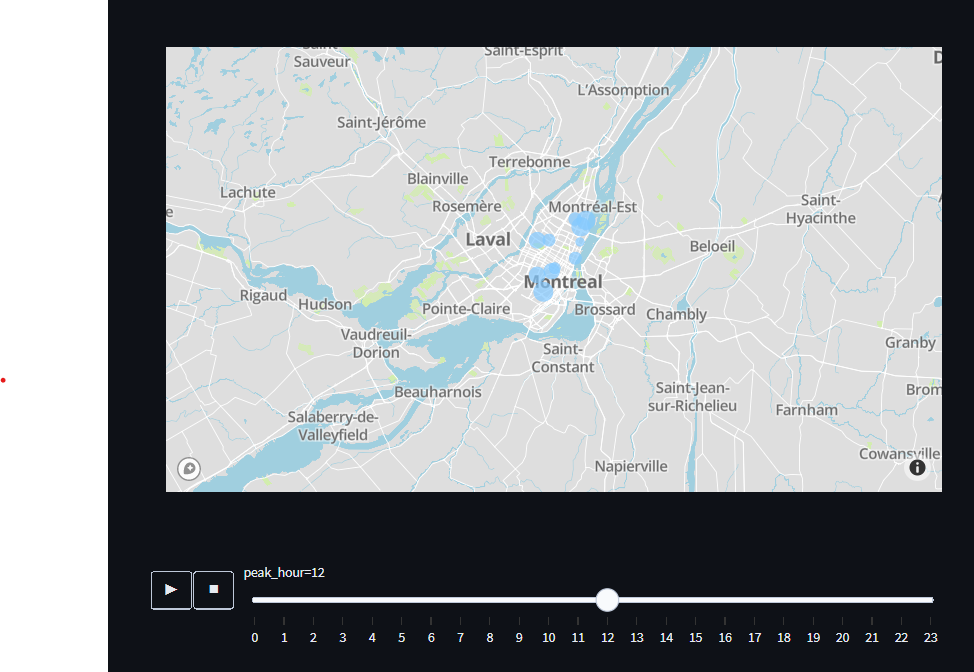
Plot animated to a later frame but still displaying the first frame
newplot (1)

Is this a regression?

  • Yes, this used to work in a previous version.

Debug info

  • Streamlit version: 1.16.0
  • Python version: 3.10.6
  • Operating System: Windows 10 Enterprise
  • Browser: Edge
  • Virtual environment:

Additional Information

N/A

Are you willing to submit a PR?

  • Yes, I am willing to submit a PR!
@georgeyoulden georgeyoulden added status:needs-triage Has not been triaged by the Streamlit team type:bug Something isn't working labels Dec 22, 2022
@bcliang
Copy link

bcliang commented Dec 27, 2022

I have a related issue when using scatter plots where the rendered traces (and PNG output from the component) is messed up because some elements on the canvas do not get removed properly.

Expected behavior (1.14.1) -- zoom in on a plotly chart and the traces should be redrawn:
plotly-chart-streamlit-1-14-1-2022-12-26-16-12-85.webm

Current behavior (1.15.0 and up) -- some old trace data persists on the canvas:
plotly-chart-streamlit-1-15-0-2022-12-26-16-12-21.webm

The above can be cleared by toggling the trace in the legend, but plotly's PNG export doesn't necessarily clear up).
plotly-chart-streamlit-1-16-0-2022-12-26-16-12-80.webm

@amdouglas
Copy link

Same issue, my scatter_mapbox points are not being removed, or added upon refresh

@kmcgrady
Copy link
Collaborator

Ah Looks like the plotly version we pull in had a bug. plotly/plotly.js#6387 It's been fixed, so we will upgrade it in the new release to fix it.

@kmcgrady
Copy link
Collaborator

This was fixed with #5885. Should be in the next release :-)

@kmcgrady kmcgrady removed the status:needs-triage Has not been triaged by the Streamlit team label Dec 30, 2022
Sign up for free to join this conversation on GitHub. Already have an account? Sign in to comment
Labels
type:bug Something isn't working
Projects
None yet
Development

Successfully merging a pull request may close this issue.

4 participants