get xAxis ticks at start of bars #2722
-
|
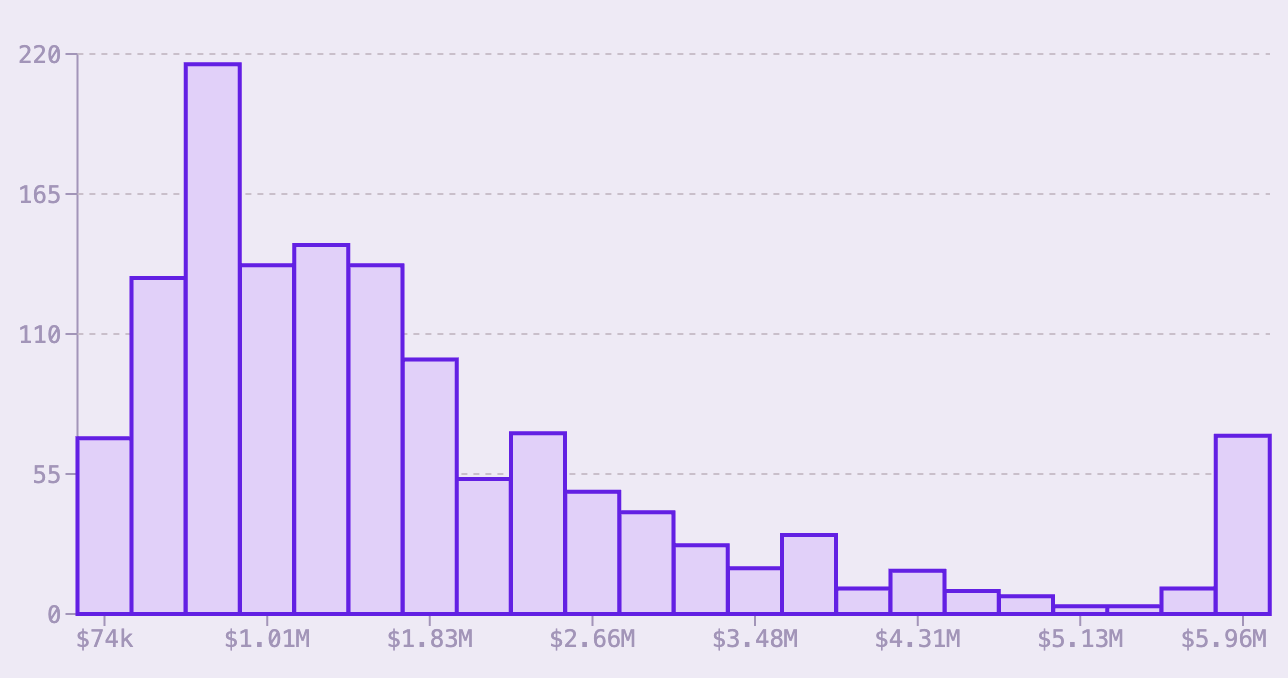
I'm trying to plot histogram using bar charts. It'd helpful if xTicks are placed at the start of bars instead of the default behaviour, where its placed in the middle as in the image below. Thanks in advance🙏
|
Beta Was this translation helpful? Give feedback.
Answered by
201flaviosilva
May 3, 2023
Replies: 1 comment
-
|
Hey, I know this thread is already kinda dead, but I think I found the answer to your question: <BarChart width={400} height={300} data={data}>
<XAxis dataKey="name" tick={null} />
<YAxis
domain={[0, "dataMax + 10"]}
/>
<Bar
dataKey="value"
fill="#8884d8"
stroke="#000"
strokeWidth={1}>
<LabelList dataKey="name" position="top" /> {/* Use this to display the label at the top of the bar */}
</Bar>
</BarChart>Here is a code running project example: https://bitbucket.org/201flaviosilva-labs/react-recharts-get-xaxis-ticks-at-start-of-bars-2722/ All code here: import { Bar, BarChart, CartesianGrid, LabelList, Tooltip, XAxis, YAxis } from "recharts";
const data = [
{ name: "A", value: 10 },
{ name: "B", value: 20 },
{ name: "C", value: 15 },
];
export default function App() {
return (
<div className="app">
<div className="container">
<BarChart width={400} height={300} data={data}>
<XAxis dataKey="name" tick={null} />
<YAxis
domain={[0, "dataMax + 10"]}
/>
<CartesianGrid />
<Tooltip />
<Bar
dataKey="value"
fill="#8884d8"
stroke="#000"
strokeWidth={1}>
<LabelList dataKey="name" position="top" /> {/* Use this to display the label at the top of the bar*/}
</Bar>
</BarChart>
</div>
</div>
);
} |
Beta Was this translation helpful? Give feedback.
0 replies
Answer selected by
ckifer
Sign up for free
to join this conversation on GitHub.
Already have an account?
Sign in to comment
Hey,
I know this thread is already kinda dead, but I think I found the answer to your question:
Here is a code running project example: https://bitbucket.org/201flaviosilva-labs/react-recharts-get-xaxis-ticks-at-start-of-bars-2722/
All code here: