Skip to content
New issue

Have a question about this project? Sign up for a free GitHub account to open an issue and contact its maintainers and the community.

By clicking “Sign up for GitHub”, you agree to our terms of service and privacy statement. We’ll occasionally send you account related emails.

Already on GitHub? Sign in to your account

[BUG] Abnormally high CPU usage on Kubernetes 1.24.4 #38816

Closed
msr-financial-com opened this issue Sep 6, 2022 · 112 comments
Closed

[BUG] Abnormally high CPU usage on Kubernetes 1.24.4 #38816

msr-financial-com opened this issue Sep 6, 2022 · 112 comments
Assignees
Labels
internal JIRA To be used in correspondence with the internal ticketing system. kind/bug Issues that are defects reported by users or that we know have reached a real release priority/0 QA/S release-note Note this issue in the milestone's release notes status/release-blocker team/hostbusters The team that is responsible for provisioning/managing downstream clusters + K8s version support

Comments

@msr-financial-com
Copy link

msr-financial-com commented Sep 6, 2022

Rancher Server Setup

  • Rancher version: v2.6.8
  • Installation option : Helm Chart
    • RKE1
    • Kubernetes: v1.24.4

Information about the Cluster

  • Kubernetes version: v1.24.4
  • Cluster Type (Local/Downstream): Downstream
    • Custom

User Information

  • What is the role of the user logged in? Admin/Cluster

Describe the bug
When creating a Custom downstream cluster with Kubernetes v1.24.x and using servers with Oracle Linux 8.6 and the kernel-uek-core 5.15, the CPU usage goes abnormally high. This issue does not occur with the Kernel kernel-core 4.18 and Kubernetes 1.24.x. No extra pods have to be deployed. It will occur immediately after the node is registered into the cluster

To Reproduce

  • Create a downstream cluster via Rancher UI and use Kubernetes v1.24 or add node to an v1.24 cluster
  • Add serves with Oracle Linux 8.6 installed and Kernel-uek-core 5.15
  • Display cpu usage("top")

Result
CPU usage goes abnormally high. While only minimum of pods are deployed
Because of this, pods are getting killed because of a shortage on CPU.

Expected Result
Normal CPU usage.

Screenshots
Number1
Number5
Number2
number4
number3
Additional context

SURE-5282

@msr-financial-com msr-financial-com added the kind/bug Issues that are defects reported by users or that we know have reached a real release label Sep 6, 2022
@msr-financial-com msr-financial-com changed the title [BUG] Very high CPU usage on Oracle Linux 8.6 with Kernel 5.15 [BUG] Abnormally high CPU usage on Oracle Linux 8.6 with Kernel 5.15 Sep 6, 2022
@cite
Copy link

cite commented Sep 7, 2022

Can confirm. This is affecting RKE1 clusters, and it doesn't matter whether it's an upgrade or a new installation. Depending on the number of pods, even when there are no state changes, dockerd will consume several 10s of CPU cores (I've seen CPU loads as high as 5000%).

The affected 5.15 kernel is called Unbreakable Enterprise Kernel 7 by Oracle.

@cite
Copy link

cite commented Sep 8, 2022

It seems this is not caused by OEL or it's kernel, since the same symptoms can be reproduced on a CentOS 7 worker node. Is it possible that the fix for rancher/rke#2938 didn't make it into Rancher 2.6.8 yet? We can see that cri-dockerd within kubelet self-identifies as 0.2.4, but it's performance is still really bad. Getting local metrics takes forever and causes and inordinate amount of CPU consumption:

# time curl -sk --key /etc/kubernetes/ssl/kube-apiserver-key.pem --cert /etc/kubernetes/ssl/kube-apiserver.pem 'https://localhost:10250/stats/summary?only_cpu_and_memory=true' >/dev/null

real	0m6.390s
user	0m0.015s
sys	0m0.003s

Additionally, the kubelet log seems to indicate that dockerd is, from time to time, too flooded with connections to respond during stats collection:

time="2022-09-08T12:17:07Z" level=error msg="Cannot connect to the Docker daemon at unix:///var/run/docker.sock. Is the docker daemon running? Failed to get stats from container 08b5ba4c0e1b0361aadc236fc872244e27d81e04a4c9813a76b61ef468f98f81"

@msr-financial-com msr-financial-com changed the title [BUG] Abnormally high CPU usage on Oracle Linux 8.6 with Kernel 5.15 [BUG] Abnormally high CPU usage on Kubernetes 1.24.4 Sep 8, 2022
@jiaqiluo
Copy link
Member

jiaqiluo commented Sep 8, 2022

This is a known issue: #38214 where we see the unexpected high memory usage of dockerd on OL 8.4 and 8.6 on k8s 1.24

@cite
Copy link

cite commented Sep 8, 2022

@jiaqiluo I don't believe this to be the same issue. In our setup, we don't see any if the error messages your linked report contains, and neither is memory consumption of the Docker daemon increased (see screenshots of the initial reporter).

EDIT: I stand corrected on the memory consumption, sorry (normally it's around 500-600M):

# systemctl status docker
● docker.service - Docker Application Container Engine
   Loaded: loaded (/usr/lib/systemd/system/docker.service; enabled; vendor preset: disabled)
  Drop-In: /etc/systemd/system/docker.service.d
           └─cgroup-driver.conf, http-proxy.conf
   Active: active (running) since Thu 2022-09-08 16:22:49 CEST; 3h 54min ago
     Docs: https://docs.docker.com
 Main PID: 1733 (dockerd)
    Tasks: 115
   Memory: 3.7G
   CGroup: /system.slice/docker.service
           └─1733 /usr/bin/dockerd -H fd:// --exec-opt native.cgroupdriver=systemd

The above is from an 1.23.10 RKE1 cluster with cri-dockerd enabled.

If it's of any interest, these are bare metal nodes, not AWS instances.

@cite
Copy link

cite commented Sep 8, 2022

@jiaqiluo Would it help if we were able to recreate this problem with CentOS 7? If so, I'll setup a new worker node and join it. The above is from an 1.23.10 cluster.

@jiaqiluo
Copy link
Member

jiaqiluo commented Sep 8, 2022

Hi @cite , it would be great if you could try it on CentOS 7 with RKE1 k8s 1.24.x? Can you also share the docker version on the node?

@cite
Copy link

cite commented Sep 9, 2022

@jiaqiluo This is not easy to pin down. I deployed a completely new RKE1 cluster with Rancher 2.6.8, two nodes OEL 8.6 with the default 4.18 kernel, one node with CentOS 7.9 with it's default 3.18 kernel.

# uname -r; rpm -q containerd.io docker-ce
3.10.0-1160.76.1.el7.x86_64
containerd.io-1.6.6-3.1.el7.x86_64
docker-ce-20.10.17-3.el7.x86_64

After deploying a cluster with version 1.23.10-rancher1 and enabling cri-dockerd, and deploying 400 nginx containers, I immediately noticed very bad metrics performance on all nodes:


real	0m4.728s
user	0m0.050s
sys	0m0.061s

There was no difference between OEL 8.6 and CentOS 7.9 workers. Furthermore, the kubelet logs showed errors like that:

E0909 10:09:37.686805   11277 remote_runtime.go:1134] "ReopenContainerLog from runtime service failed" err="rpc error: code = Unknown desc = docker does not support reopening container log files" containerID="80faaaf76cf140f5fe00b9615face7d1c38fc9fad12f85cbf565ee318252d93b"
E0909 10:09:37.686836   11277 container_log_manager.go:244] "Container log doesn't exist, reopen container log failed" err="rpc error: code = Unknown desc = docker does not support reopening container log files" containerID="80faaaf76cf140f5fe00b9615face7d1c38fc9fad12f85cbf565ee318252d93b" path="/var/log/pods/default_echo-75f946c956-tq9jl_20de94b8-9589-4a3f-a751-d41759751e60/echo/0.log"
time="2022-09-09T10:09:39Z" level=error msg="Cannot connect to the Docker daemon at unix:///var/run/docker.sock. Is the docker daemon running? Failed to get stats from container 964410c5c8e039140b36ded75cd83500f168cfb65d023b8f33753d513f0ba19d"
[...repeated several 10s of times...]
E0909 10:09:39.066200   11277 remote_runtime.go:351] "ListPodSandbox with filter from runtime service failed" err="rpc error: code = Unknown desc = Cannot connect to the Docker daemon at unix:///var/run/docker.sock. Is the docker daemon running?" filter="nil"
E0909 10:09:39.066233   11277 kuberuntime_sandbox.go:292] "Failed to list pod sandboxes" err="rpc error: code = Unknown desc = Cannot connect to the Docker daemon at unix:///var/run/docker.sock. Is the docker daemon running?"
E0909 10:09:39.066244   11277 generic.go:205] "GenericPLEG: Unable to retrieve pods" err="rpc error: code = Unknown desc = Cannot connect to the Docker daemon at unix:///var/run/docker.sock. Is the docker daemon running?"
time="2022-09-09T10:09:41Z" level=info msg="Using CNI configuration file /etc/cni/net.d/10-canal.conflist"
time="2022-09-09T10:09:46Z" level=info msg="Using CNI configuration file /etc/cni/net.d/10-canal.conflist"
E0909 10:09:48.029518   11277 remote_runtime.go:1134] "ReopenContainerLog from runtime service failed" err="rpc error: code = Unknown desc = docker does not support reopening container log files" containerID="80faaaf76cf140f5fe00b9615face7d1c38fc9fad12f85cbf565ee318252d93b"
E0909 10:09:48.029547   11277 container_log_manager.go:244] "Container log doesn't exist, reopen container log failed" err="rpc error: code = Unknown desc = docker does not support reopening container log files" containerID="80faaaf76cf140f5fe00b9615face7d1c38fc9fad12f85cbf565ee318252d93b" path="/var/log/pods/default_echo-75f946c956-tq9jl_20de94b8-9589-4a3f-a751-d41759751e60/echo/0.log"

Again, there was no difference between the CentOS 7.9 and OEL 8.6 workers. The metrics performance is suprising, because rancher/rke#2938 states that the version of cri-dockerd as shipped with Rancher is 0.2.4, which should include Mirantis/cri-dockerd#38.

For all nodes, memory consumption of dockerd was increased by about 600% compared to normal. Also, CPU usage for dockerd was about 10x what we normally see on an idle cluster - with CentOS 7.9 faring about 2x better than OEL 8.6.

When disabling cri-dockerd, the logfiles immediately went back to normal, CPU consumption went back to normal, and memory consumption didn't increase anymore after restarting dockerd. Also, metrics are available about 100x faster:

# time curl -sk -H "Authorization: Bearer $b" 'https://localhost:10250/stats/summary?only_cpu_and_memory=true' >/dev/null

real	0m0.116s
user	0m0.045s
sys	0m0.058s

Upgrading the cluster to 1.24.4 didn't make any difference to the situation of running 1.23.10 with cri-dockerd enabled.

Looking at the code changes for Mirantis/cri-dockerd#38, it seems that metrics are available faster in that case because collecting them is parallelized by distributing the work to several goroutines. Is it possible that with a large number of pods, the parallel queries overwhelm dockerd (or hit somaxconn on it's unix domain socket)?

Conclusion: Enabling cri-dockerd seems to have a larger impact than the worker nodes' OS. However, there is a definitive degradation on OEL 8.6 when compared to CentOS 7.9.

Do you want me to perform other tests or ship more data?

@chfrank-cgn
Copy link

I've observed the same behavior on Ubuntu 20.04 LTS (RKE 1.24.4 from Rancher 2.6.8)

@chfrank-cgn
Copy link

Same issue, independent of whether I upgrade from 1.23.10 to 1.24.4 or install 1.24.4 right away - CPU usage on the nodes goes through the roof, with dockerd continuously using 290 to 310%.

Stopping kube-metrics-server and Prometheus ease the situation somewhat, but CPU usage remains high.

Right on the time of the upgrade, error messages appear in metrics server:

E0911 17:00:10.466866 1 scraper.go:140] "Failed to scrape node" err="Get \"https://10.240.0.5:10250/metrics/resource\": dial tcp 10.240.0.5:10250: connect: connection refused" node="rke-f51ad0-0" E0911 17:00:38.955105 1 scraper.go:140] "Failed to scrape node" err="Get \"https://10.240.0.5:10250/metrics/resource\": context deadline exceeded" node="rke-f51ad0-0"

@chfrank-cgn
Copy link

Screenshot_2022-09-11_19-06-33

@jiaqiluo jiaqiluo added team/hostbusters The team that is responsible for provisioning/managing downstream clusters + K8s version support [zube]: Team Area 2 labels Sep 12, 2022
@jiaqiluo jiaqiluo added this to the v2.7.0 milestone Sep 12, 2022
@thaneunsoo
Copy link
Contributor

thaneunsoo commented Sep 13, 2022

I tried to reproduce on 2.6.8

Reproduction Steps
Fresh

  1. Create custom rke downstream cluster with 1.24 k8s version (cri-dockerd is enabled by default)
  2. Install monitoring on the cluster
  3. Verify CPU usage using Grafana
  4. Verify CPU usage by ssh into control plane node and running top command

Upgrade

  1. Create custom rke downstream cluster with 1.23 k8s version using Ubuntu 20.04 (enable cri-dockerd)
  2. Install monitoring on the cluster
  3. Verify CPU usage using Grafana
  4. Verify CPU usage by ssh into control plane node and running top command
  5. Upgrade k8s version to 1.24
  6. Repeat steps 3-4

Result
I was not able to reproduce the behavior seen in this ticket

Update
I was able to reproduce this issue on azure instances but not ec2 instances.

@cite
Copy link

cite commented Sep 13, 2022

@thaneunsoo Were you able to reproduce metrics timings (with curl)? Why did you ssh into a Control Plane node and not a worker node that hosts pods? Also, your reproduction steps don't include generating a large number of pods.

EDIT: If the problem is related to metrics (or other interactions between cri-dockerd and dockerd), then looking at a node where not a lot is going on will not necessarily show the problem. The timings I have taken so far are all from a worker node with >100 pods (doesn't matter what kind of workload, just to make sure it's not creating CPU load by itself). Also, besides the CPU load and metrics timings, the kubelet error messages are also a sure sign of this problem happening.

@chfrank-cgn
Copy link

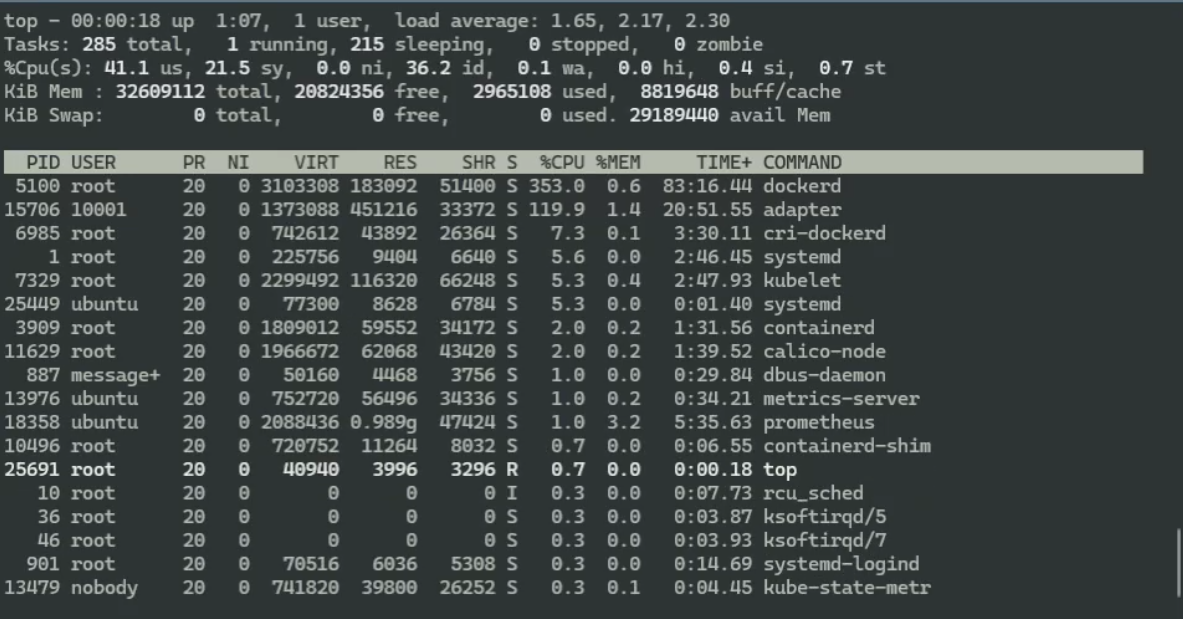
After @thaneunsoo tried to reproduce the issue and failed, I had another go:

Rancher 2.6.8, 3-node custom downstream cluster on Azure VMs with v1.23.10-rancher1-1 on Ubuntu 20.04.5 LTS / Docker 20.10.18 with Kernel: Linux rke-6d3730-0 5.15.0-1019-azure #24~20.04.1-Ubuntu SMP Tue Aug 23 15:52:52 UTC 2022 x86_64 x86_64 x86_64 GNU/Linux

Top shows minimal CPU consumption, same for Grafana.

before-Top

before-ClusterNodes

@chfrank-cgn
Copy link

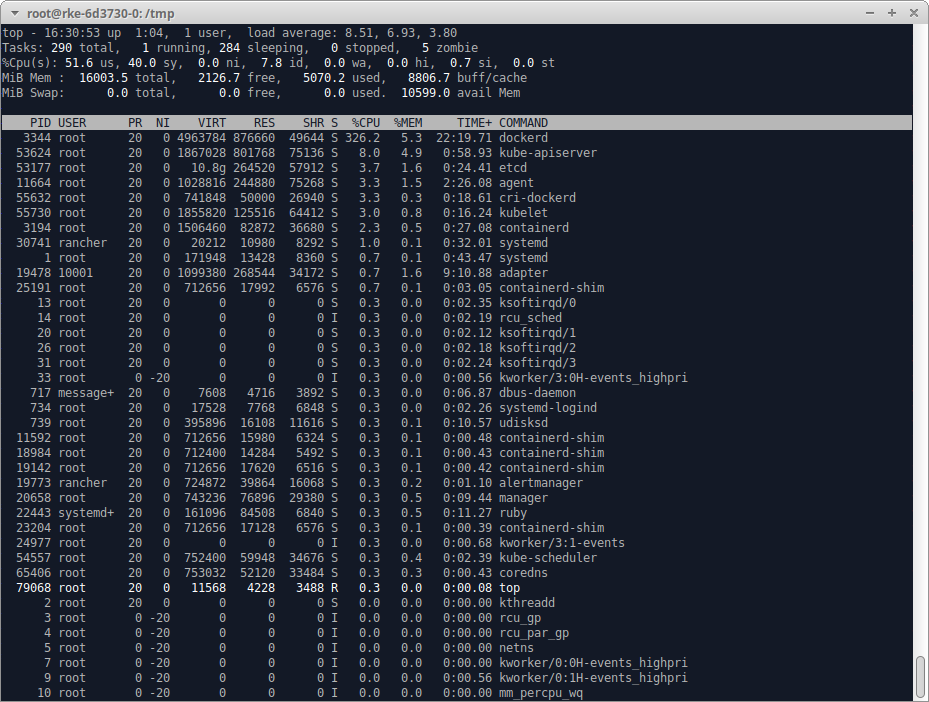
Next step, updating from the Rancher UI to v1.24.4-rancher1-1

CPU consumption goes way up, both in top and in Grafana:

after-Top

after-ClusterNodes

@chfrank-cgn
Copy link

Observations:

1/ metrics server complains about:
"Failed to scrape node" err="Get "https://10.241.0.6:10250/metrics/resource\": context deadline exceeded" node="rke-6d3730-0"

2/ docker complains a lot about:
Sep 13 16:33:29 rke-6d3730-0 systemd[1]: run-docker-runtime\x2drunc-moby-c90591c07b9383e658d7d6c7afcb24e84e76f0a2967bb7a86e26155765482065-runc.SY6JlR.mount: Succeeded.
Sep 13 16:33:30 rke-6d3730-0 systemd[30741]: var-lib-docker-overlay2-2da63044debc6b41d909672da6721d19243237777b0a9659abb729feac1467f3\x2dinit-merged.mount: Succeeded.

@chfrank-cgn
Copy link

dockerd spends most of its time in path/filepath.Clean and runtime.scanobject, according to perf top

strace shows that it seems to be iterating/looping around content in/var/lib/rancher-data/local-catalogs/, repeatedly calling lgetxattr() and newfstatat(), with repeated SIGURGs in between

@snasovich snasovich modified the milestones: v2.7.2, v2.7-KDM-For-2.6.11 Feb 21, 2023
@snasovich
Copy link
Collaborator

Moved this to v2.7-KDM-For-2.6.11 milestone, the move of changes to correct KDM branch is being done per rancher/kontainer-driver-metadata#1089.

@sowmyav27
Copy link
Contributor

@thaneunsoo please validate on 2.7.1 Rancher using KDM branch dev-v2.7-for-2.6.11 for this issue ^

@cite
Copy link

cite commented Feb 23, 2023

@kinarashah Will this fix be included in standalone RKE1 clusters, too? If so, do you know which version of RKE1 the changes are targeted for?

@kinarashah
Copy link
Member

@cite Yeah, the standalone RKE versions v1.3.19 and v1.4.3 will also have this fixed version. If you wanted to check it out, v1.3.19-rc2 and v1.4.3-rc7 have v1.24.10-rancher3-1.

@thaneunsoo
Copy link
Contributor

thaneunsoo commented Feb 24, 2023

thaneunsoo said: ### Test Environment: ###
Rancher version: v2.7.1 with KDM dev-v2.7-for-2.6.11 branch
Rancher cluster type: HA
Docker version: 20.10

Downstream cluster type: rke1


Testing:

Tested this issue with the following steps:

  1. Create ami with overlay native diff configurations set
  • set config for overlay and native diff
    • add/change configuration for overlay/overlay2 in etc/docker/daemon.json
{
  "storage-driver": "overlay2"
}
  • restart docker
  • set config for native diff
    • Add the following to /etc/modprobe.d/disable-overlay-redirect-dir.conf
options overlay metacopy=off redirect_dir=off
  • stop docker, reload the module, and restart docker
systemctl stop docker
modprobe -r overlay
modprobe overlay
systemctl start docker
  1. Install KVM ( was unable to reproduce without kvm for some reason)
  • sudo apt install cpu-checker
    3.Create downstream rke1 cluster using 1.24
  1. Create multiple pods (created 100 generic pods)
  • for i in {1..100}; do kubectl run test$i --image=nginx --port=80; done
  1. Display cpu usage("top")

Side note

  • 1.23 cluster was also created to check for differences/similarities
  • Used aws node driver and also azure node driver clusters for testing with 3 etcd, 2 cp, 3 worker

Cases covered:

  1. overlay with native diff true
  2. overlay with native diff false
  3. overlay2 with native diff true
  4. overlay2 with native diff false

Result

1. overlay with native diff true

  • before the fix, the cpu usage was image.png
  • after the fix, the cpu usage is now image.png

2. overlay with native diff false

  • before the fix the cpu usage was image.png
  • after the fix, the cpu usage is now image.png

3. overlay2 with native diff true

  • before the fix the cpu usage was image.png
  • after the fix, the cpu usage is now image.png

4. overlay2 with native diff false

  • before the fix the cpu usage was image.png
  • after the fix, the cpu usage is now image.png

Additional Testing
Tested upgrading k8s version with the following steps:

  1. Follow repro steps from above
  2. After reproducing the issue, change kdm branch from the default release-v2.7 to dev-v2.7-for-2.6.11
  3. Go to cluster and edit config
  4. Upgrade k8s version to 1.24.10-rancher4-1
  • If you don't see 1.24.10-rancher4-1 then kdm branch has not been updated correctly
  1. Save
  2. Wait for cluster upgrade to complete
  3. Verify cpu load in worker node

Result
Before the fix the cpu usage was spiking around 160% (apologies for no screenshot, but very similar results as repro images above)
After the k8s upgrade, the cpu load drastically improved image.png

@kinarashah
Copy link
Member

@thaneunsoo @git-ival
As discussed offline, I've updated version to v1.24.10-rancher4-1 in KDM. It doesn't have any new code changes - just build changes to reflect the right k8s version.

KDM branch: dev-v2.7-for-2.6.11 / dev-v2.6
RKE RC: v1.4.3-rc8/ v1.3.19-rc3

@git-ival
Copy link

Test Environment:

Rancher Cluster Config:

Rancher version: v2.7.1 with KDM dev-v2.7-for-2.6.11 branch
Rancher cluster type: HA , 3 all-roles nodes, 1 worker node (tainted to run rancher-monitoring)
Docker version: 20.10
K8s version: v1.24.10-rancher3-1

Downstream Cluster Config:

Downstream cluster type: HA RKE1, 5 etcd nodes, 6 control-plane nodes, 10 worker nodes
Installed apps: rancher-monitoring
K8s version: v1.24.10-rancher3-1

Reproduction Results:

I was able to reproduce on overlay, and overlay2 for pre-fix K8s versions. I saw CPU usage on the downstream worker nodes climb up to the 400%+ range every few minutes. I found it easier to reproduce on overlay2 with native diff overlay off.

Overlay repro:

Pasted image 20230224195535

Overlay2 Native Diff false repro:

Pasted image 20230227132149

Overlay2 Native Diff true repro:

Pasted image 20230224195900

Test Steps:

  1. Create Rancher cluster
    • Ensure the KDM branch is set to the dev-v2.7-for-2.6.11 branch by setting the rke-metadata-config Global Setting url value
  2. Create Downstream cluster (1 for each case below)
    • Create NodeTemplates for each Downstream cluster
      • Set the Engine Option for the Storage Driver as appropriate for the current test case
  3. Wait for Downstream cluster to provision
  4. (Overlay2 only) Set Native Overlay Diff on each cluster node as needed:
    1. Stop docker
    2. Reload the modprobe modules
    3. Set modprobe options for Native Diff
    4. Start docker
      systemctl stop docker && modprobe -r overlay && modprobe overlay metacopy=off redirect_dir=off && systemctl start docker
  5. Scale-in a large # of pods (created 900 nginx Deployments with 1 pod each)
  6. SSH into a control-plane and worker node
  7. Run top to monitor CPU usage as scale-in proceeds
  8. Once scale-in completes, proceed to Grafana metrics to confirm resource usager %s

Notes:

  • Provisioned all clusters via Terraform
  • Downstreams were all AWS nodedriver clusters
  • Used grafana metrics for results screenshots since the top screenshots are less useful

Cases covered:

  1. Overlay
  2. Overlay2 with native diff true
  3. Overlay2 with native diff false

Test Case Results:

Overlay - Test Case Results:

Pre Pod Scale-in Phase:

  • 17% CPU usage
  • 6% Memory Usage

Post Pod Scale-in:

  • CPU Usage never reaches > 77%
  • Memory Usage never reaches > 47%

Pasted image 20230224003826
Pasted image 20230224004900

Overlay2 Native Diff false - Test Case Results:

Pre Pod Scale-in Phase:

  • ~13% CPU usage
  • ~4% Memory Usage

Post Pod Scale-in:

  • CPU Usage never reaches > 60%
  • Memory Usage never reaches > 51%

Pasted image 20230224004415
Pasted image 20230224004919

Overlay2 Native Diff true - Test Case Results:

Pre Pod Scale-in Phase:

  • ~12% CPU usage
  • ~3% Memory Usage

Post Pod Scale-in:

  • CPU Usage never reaches > 70%
  • Memory Usage never reaches > 53%

Pasted image 20230224004433
Pasted image 20230224004936

@git-ival
Copy link

Validations completed, closing.

@zube zube bot closed this as completed Feb 28, 2023
@qeternity
Copy link

Hi @kinarashah thanks so much for your hard work. I know it's not GA but we've deployed 1.25.6-rancher4-1 to our dev cluster and have seen massive reduction in CPU usage.

@zube zube bot removed the [zube]: Done label May 30, 2023
@immanuelfodor
Copy link

Can confirm the CPU issue fixed: upgraded v1.23.16-rancher2-1 -> v1.24.13-rancher2-1 with enable_cri_dockerd: true in RKE1 and the CPU usage is normal.

Sign up for free to join this conversation on GitHub. Already have an account? Sign in to comment
Labels
internal JIRA To be used in correspondence with the internal ticketing system. kind/bug Issues that are defects reported by users or that we know have reached a real release priority/0 QA/S release-note Note this issue in the milestone's release notes status/release-blocker team/hostbusters The team that is responsible for provisioning/managing downstream clusters + K8s version support
Projects
None yet
Development

No branches or pull requests