Module view dose not show device time #733
Comments
|
btw, because my trace.json data is very large, the opening of tensorboard is very slow, sometimes even OOM. So is there a way to output profiling data in raw str? like this: |

|
2/27 UPDATE import torch
import torch.nn
import torch.optim
import torch.profiler
import torch.utils.data
import torchvision.datasets
import torchvision.models
import torchvision.transforms as T
transform = T.Compose(
[T.Resize(224),
T.ToTensor(),
T.Normalize((0.5, 0.5, 0.5), (0.5, 0.5, 0.5))])
train_set = torchvision.datasets.CIFAR10(root='./data', train=True, download=True, transform=transform)
train_loader = torch.utils.data.DataLoader(train_set, batch_size=32, shuffle=True)
device = torch.device("cuda:0")
model = torchvision.models.resnet18(pretrained=True).cuda(device)
criterion = torch.nn.CrossEntropyLoss().cuda(device)
optimizer = torch.optim.SGD(model.parameters(), lr=0.001, momentum=0.9)
model.train()
def train(data):
inputs, labels = data[0].to(device=device), data[1].to(device=device)
outputs = model(inputs)
loss = criterion(outputs, labels)
optimizer.zero_grad()
loss.backward()
optimizer.step()
with torch.profiler.profile(
activities=[
torch.profiler.ProfilerActivity.CPU,
torch.profiler.ProfilerActivity.CUDA],
schedule=torch.profiler.schedule(wait=1, warmup=1, active=3, repeat=2),
on_trace_ready=torch.profiler.tensorboard_trace_handler('./log/resnet18'),
record_shapes=True,
profile_memory=True,
with_stack=True
) as prof:
for step, batch_data in enumerate(train_loader):
if step >= (1 + 1 + 3) * 2:
break
train(batch_data)
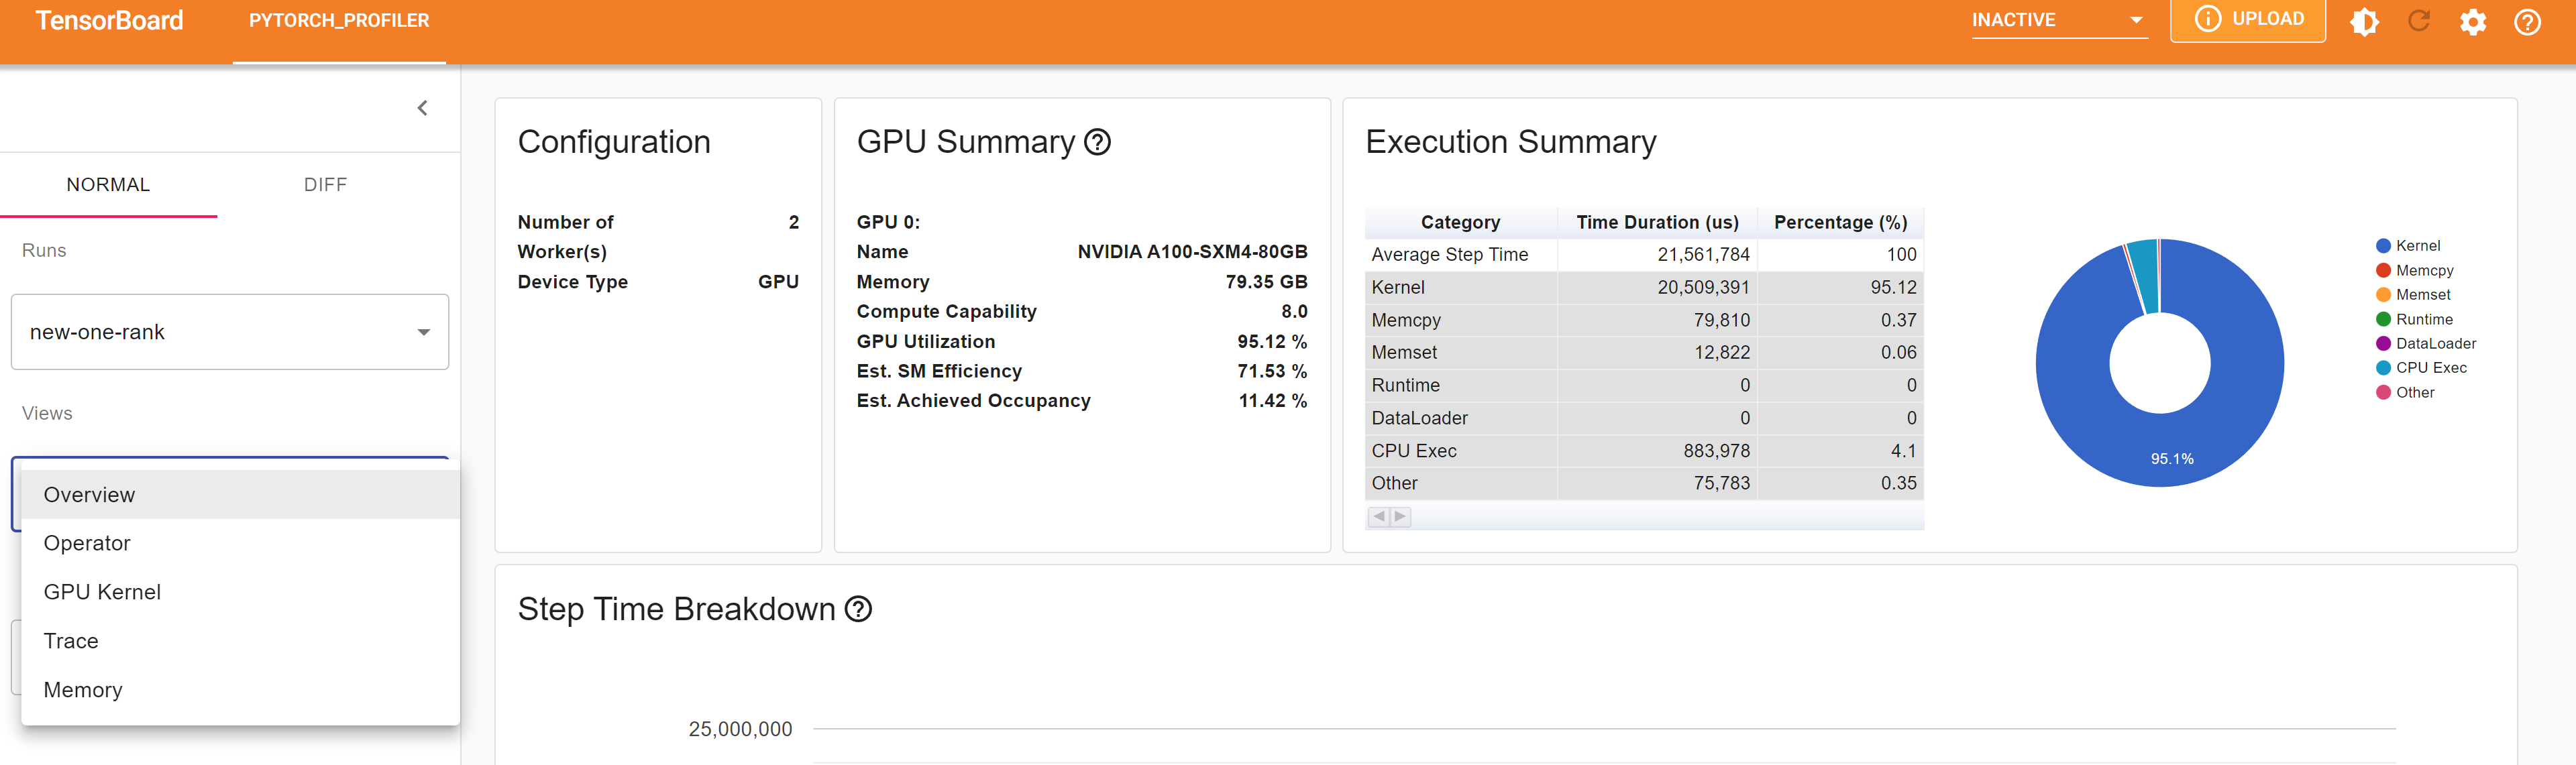
prof.step() # Need to call this at the end of each step to notify profiler of steps' boundary.But the sad thing is that the module view still doesn't show the device time, however my pytorch version has been upgraded to the latest version:
|

|
I faced the same issue, have you found the solution? |
|
same issue |
Sign up for free
to join this conversation on GitHub.
Already have an account?
Sign in to comment
Hi guys, I'm recently trying to use
torch.profilefor profiling of a large NLP model. However, I have encountered some problems and would like to get some advice:I found that only
with_modules=Trueandwith_stack=Trueare set at the same time, the tensorboard page will display the view of module. Otherwise, the module view option cannot be found in the browser, like:In the view of module, there is no device time data, but I have added
ProfilerActivity.CUDAin profile activities.Here is an example of my code :
I'm not sure if this is a version related issue, here is my version info:
UPDATE: Today I upgraded torch version, but this problem still exists:
The text was updated successfully, but these errors were encountered: