Skip to content
This repository has been archived by the owner on Aug 13, 2019. It is now read-only.

Prometheus restart very slowly when the size of data folder is huge #611

Closed
godliness opened this issue May 27, 2019 · 18 comments
Closed

Prometheus restart very slowly when the size of data folder is huge #611

godliness opened this issue May 27, 2019 · 18 comments

Comments

@godliness
Copy link

godliness commented May 27, 2019

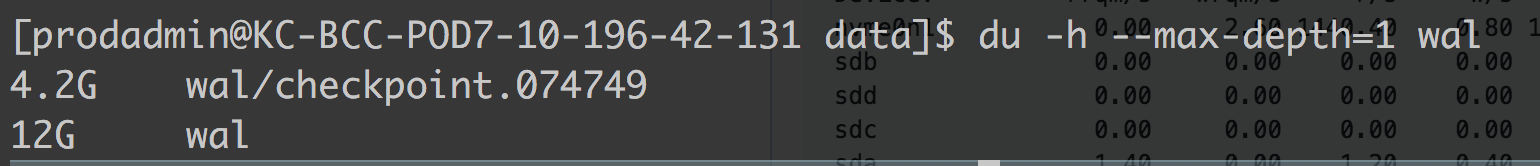
Prometheus need replay the whole wal to provide service, before that we access the prometheus web page which display "service unavailable".

Below is my condition

size of wal: 50G
startup params:

/export/prometheus/prometheus --config.file=./config.yml --storage.tsdb.path=/export/prometheus/data --storage.tsdb.retention=14d --storage.tsdb.max-block-duration=30m --storage.tsdb.min-block-duration=30m --web.enable-lifecycle --web.enable-admin-api --web.listen-address=0.0.0.0:80

go version: 1.12.5
prometheus version: 2.6.0

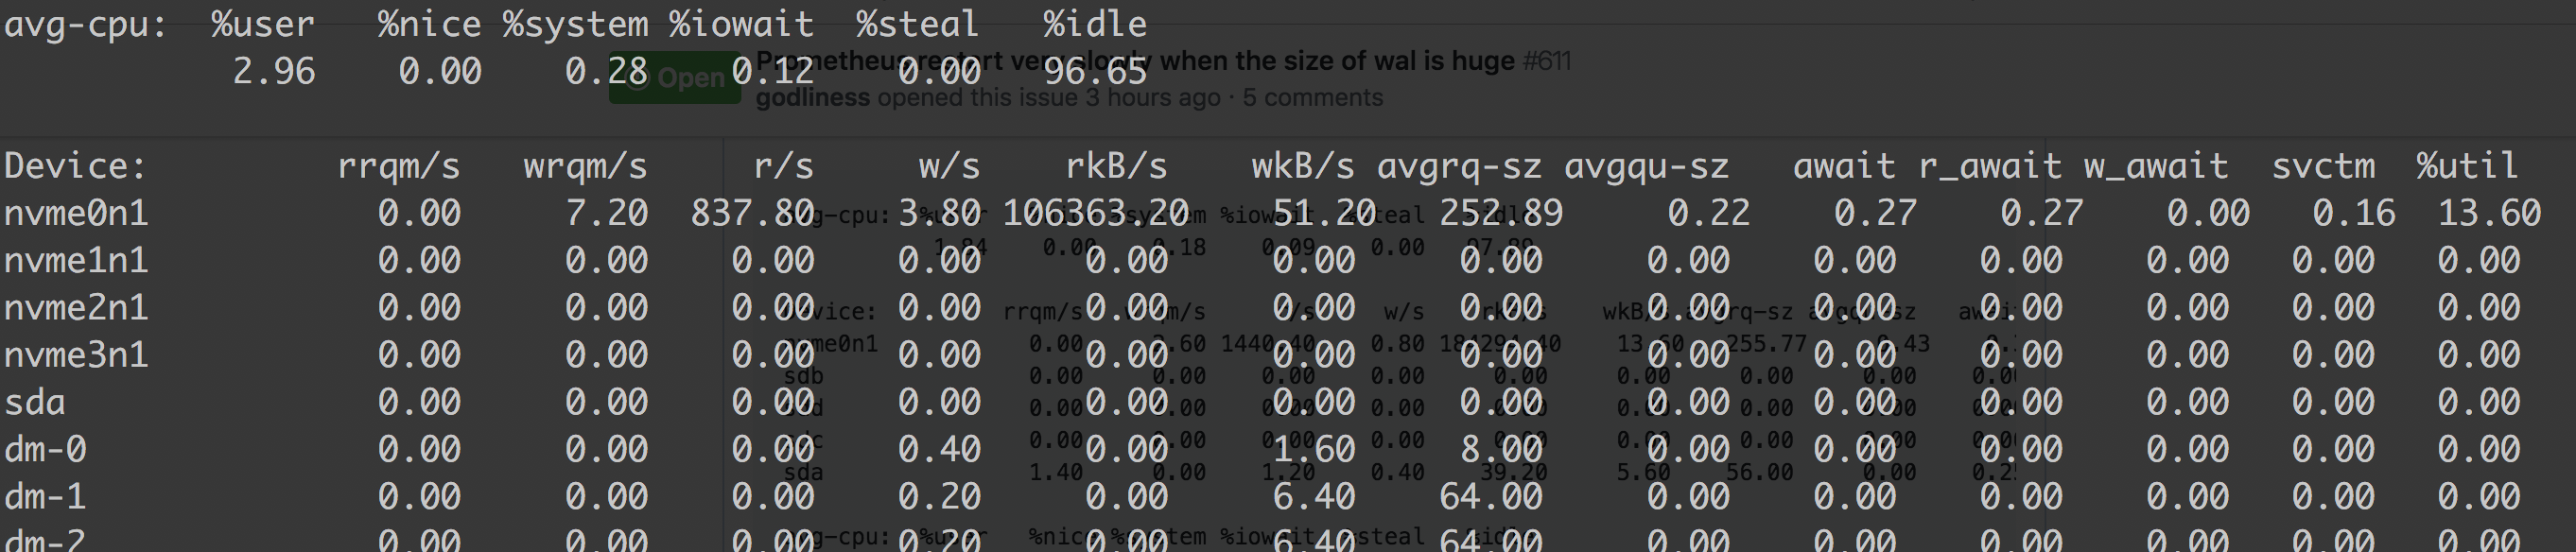
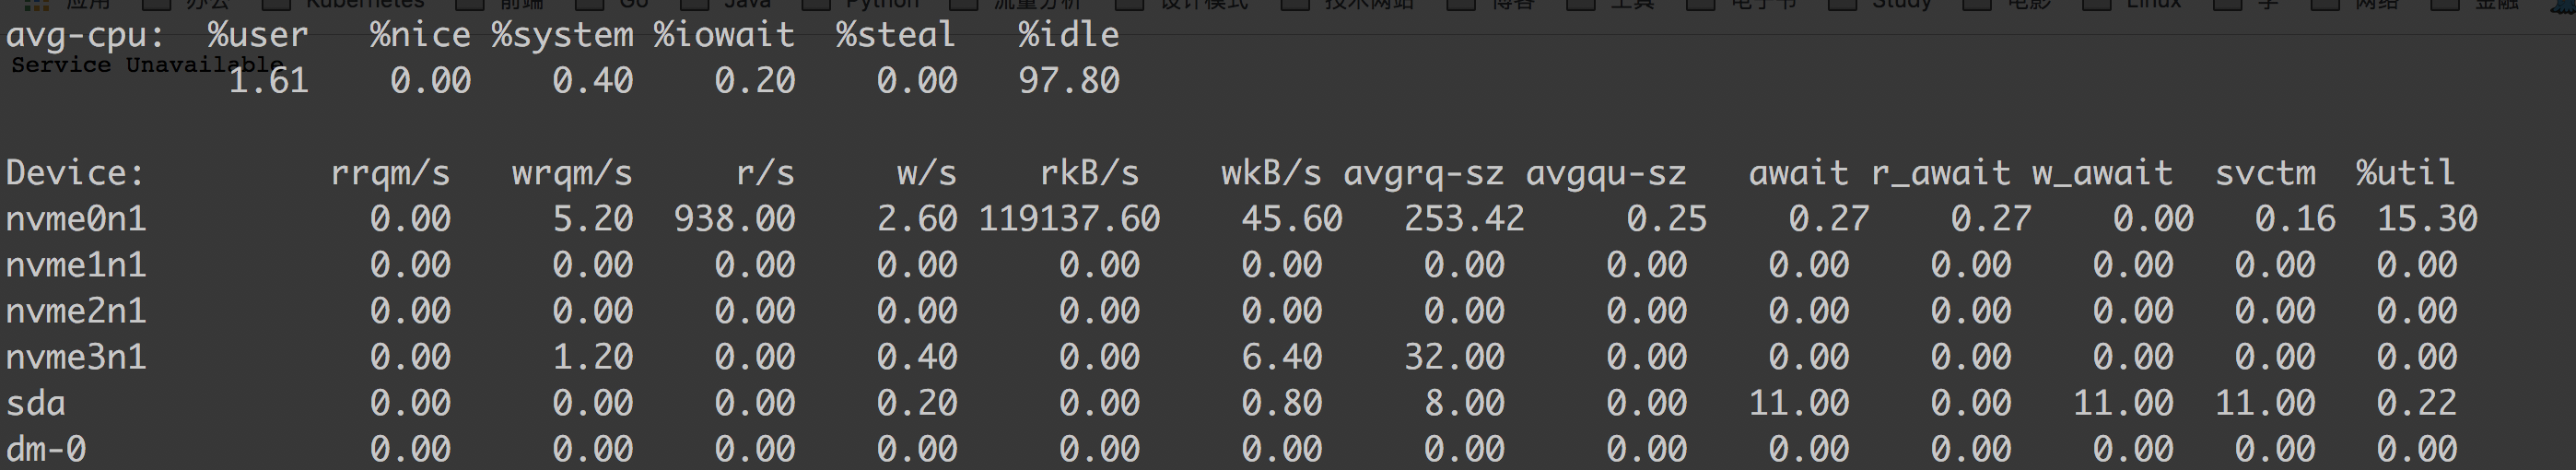
When i restart prometheus which will cost me about 9 minutes, use iostat to check the read speed which is about 100MB/s on device nvme ssd disk.

As i know, when prometheus restart that it will load wal synchronously and send the content into input channel and goroutines(cpu counts) will processWALSamples concurrently.

loadWAL will load wal one by one and depends on fixed buf size, why we do not load it concurrently or enlarge the buf size to improve the restart efficiency?

And do you have any other good ideas to cut down the restart time?

Many thanks for any possible help!

/cc @brian-brazil @krasi-georgiev

@krasi-georgiev
Copy link
Contributor

loadWAL will load wal one by one and depends on fixed buf size, why we do not load it concurrently

I think the loading needs to happen sequentially so that the series Id are loaded first and than the samples can be matched against these series.

or enlarge the buf size to improve the restart efficiency?

I think Fabian mentioned that he experimented with a different buffer sizes, but no harm in experimenting again.

@brian-brazil
Copy link
Contributor

2.6 already includes big improvements. I'd wonder if it's the CPU that got maxed out, or your disk.

@godliness
Copy link
Author

@brian-brazil @krasi-georgiev

Thanks for this quick replay!

My prometheus run as pod in KUBERNETES cluster which cpu limit is 30 cores and disk mount to hostPath which is NVME ssd. When i restart prometheus with 50G WAL that will takes too long time to restart.

Later on, i will upgrade the prometheus to v2.10.0 and then profiling it also provide the cpu.profile file for us.

@brian-brazil
Copy link
Contributor

Can you show the output of iostat -x 5 while the WAL reading is in place? There's no notable improvements up to 2.10 here, they were all in 2.6.

@godliness
Copy link
Author

godliness commented May 27, 2019

@brian-brazil

Below is not k8s cluster that is run as systemd, wal is 568G wal/

prometheus version: v2.6.1
go: 1.11.5

Start 2 minutes:

Device:         rrqm/s   wrqm/s     r/s     w/s    rkB/s    wkB/s avgrq-sz avgqu-sz   await r_await w_await  svctm  %util
nvme0n1           0.00     1.20 4242.80    0.40 542216.80     6.40   255.57     1.28    0.30    0.30    0.00   0.17  72.54
sdb               0.00     0.00    0.00    0.00     0.00     0.00     0.00     0.00    0.00    0.00    0.00   0.00   0.00
sdd               0.00     0.00    0.00    0.00     0.00     0.00     0.00     0.00    0.00    0.00    0.00   0.00   0.00
sdc               0.00     0.00    0.00    0.00     0.00     0.00     0.00     0.00    0.00    0.00    0.00   0.00   0.00
sda               0.00     0.00    0.00    0.20     0.00     1.60    16.00     0.00    0.00    0.00    0.00   0.00   0.00

avg-cpu:  %user   %nice %system %iowait  %steal   %idle
           0.36    0.00    0.18    0.28    0.00   99.19

Device:         rrqm/s   wrqm/s     r/s     w/s    rkB/s    wkB/s avgrq-sz avgqu-sz   await r_await w_await  svctm  %util
nvme0n1           0.00     1.40 4451.20    0.60 568295.20     8.00   255.31     1.30    0.29    0.29    0.00   0.17  74.08
sdb               0.00     0.00    0.00    0.00     0.00     0.00     0.00     0.00    0.00    0.00    0.00   0.00   0.00
sdd               0.00     0.00    0.00    0.00     0.00     0.00     0.00     0.00    0.00    0.00    0.00   0.00   0.00
sdc               0.00     0.00    0.00    0.00     0.00     0.00     0.00     0.00    0.00    0.00    0.00   0.00   0.00
sda               0.00     0.00    0.00    1.00     0.00     4.80     9.60     0.00    0.00    0.00    0.00   0.00   0.00

Start after about 2 minutes which going to stable:

avg-cpu:  %user   %nice %system %iowait  %steal   %idle
           1.84    0.00    0.18    0.09    0.00   97.89

Device:         rrqm/s   wrqm/s     r/s     w/s    rkB/s    wkB/s avgrq-sz avgqu-sz   await r_await w_await  svctm  %util
nvme0n1           0.00     2.60 1440.40    0.80 184294.40    13.60   255.77     0.43    0.30    0.30    0.00   0.18  25.46
sdb               0.00     0.00    0.00    0.00     0.00     0.00     0.00     0.00    0.00    0.00    0.00   0.00   0.00
sdd               0.00     0.00    0.00    0.00     0.00     0.00     0.00     0.00    0.00    0.00    0.00   0.00   0.00
sdc               0.00     0.00    0.00    0.00     0.00     0.00     0.00     0.00    0.00    0.00    0.00   0.00   0.00
sda               1.40     0.00    1.20    0.40    39.20     5.60    56.00     0.00    0.25    0.33    0.00   0.25   0.04

avg-cpu:  %user   %nice %system %iowait  %steal   %idle
           1.78    0.00    0.16    0.15    0.00   97.91

Device:         rrqm/s   wrqm/s     r/s     w/s    rkB/s    wkB/s avgrq-sz avgqu-sz   await r_await w_await  svctm  %util
nvme0n1           0.00     1.60 1612.00    3.20 206246.40    19.20   255.41     0.48    0.30    0.30    0.00   0.18  28.42
sdb               0.00     0.00    0.00    0.00     0.00     0.00     0.00     0.00    0.00    0.00    0.00   0.00   0.00
sdd               0.00     0.00    0.00    0.00     0.00     0.00     0.00     0.00    0.00    0.00    0.00   0.00   0.00
sdc               0.00     0.00    0.00    0.00     0.00     0.00     0.00     0.00    0.00    0.00    0.00   0.00   0.00
sda               0.00     0.00    0.40    0.40     1.60     2.40    10.00     0.00    0.50    1.00    0.00   0.25   0.02

Restart will takes 1 hour

Cpu profile
cpu.216.6.out.zip

@godliness
Copy link
Author

godliness commented May 27, 2019

@brian-brazil

Below is our K8S cluster prometheus run as pod, version is 2.6.0
go: 1.12.5

WAL:
image
iostat -x 5

It's very stable which is about 100MB/s on the nvme device ssd.

image
image

Restart will takes 11 minutes.

cpu profile

cpu.out.zip

@brian-brazil
Copy link
Contributor

There's tons of spare CPU there, so this sounds like a throughput issue on your disk.

@krasi-georgiev
Copy link
Contributor

These are more or less the same timings we see at Prombench.

@godliness
Copy link
Author

godliness commented May 28, 2019

@brian-brazil

I have tested my disk device on the k8s node with prometheus pod.

Test Disk I/O write:

[root@KC-BCC-POD7-10-196-42-131 prometheus]# sync;/usr/bin/time -p bash -c "(dd if=/dev/zero of=test.dd  bs=1000K count=20000;sync)"
20 GB,20.5489 s,997 MB/s
real 20.83
user 0.01
sys 16.46

Test Disk I/O Read:

[root@KC-BCC-POD7-10-196-42-131 prometheus]# echo 3 > /proc/sys/vm/drop_caches ; /usr/bin/time -p dd if=test.dd of=/dev/null  bs=1M
20 GB,24.5904 s,833 MB/s
real 24.62
user 0.00
sys 7.41

So the read speed looks good from testing i think, but when prometheus read from the same device and the speed is about 100MB/s; i guess there are some limits in wal reader, but i'm not sure and still finding evidence to prove it.

@krasi-georgiev Do you mean that you hav already find the reading bottleneck of tsdb by Prombench?

@krasi-georgiev
Copy link
Contributor

krasi-georgiev commented May 28, 2019

I meant that when running benchmarking test on Prombench the startup time after a restart is around 14m which is similar to what you have observed.

Here is link to the comment for the startup time of the the last test we did.
prometheus/prometheus#5592 (comment)

@brian-brazil
Copy link
Contributor

How many cores do you have, and is there hyperthreading?

@godliness
Copy link
Author

godliness commented May 28, 2019

@brian-brazil

[prodadmin@KC-BCC-POD7-10-196-42-131 ~]$ lscpu
Architecture:          x86_64
CPU op-mode(s):        32-bit, 64-bit
Byte Order:            Little Endian
CPU(s):                48
On-line CPU(s) list:   0-47
Thread(s) per core:    2
Core(s) per socket:    12
Socket(s):             2
NUMA node(s):          2
Vendor ID:             GenuineIntel
CPU family:            6
Model:                 79
Model name:            Intel(R) Xeon(R) CPU E5-2650 v4 @ 2.20GHz
Stepping:              1
CPU MHz:               2499.921
BogoMIPS:              4395.52
Virtualization:        VT-x
L1d cache:             32K
L1i cache:             32K
L2 cache:              256K
L3 cache:              30720K
NUMA node0 CPU(s):     0-11,24-35
NUMA node1 CPU(s):     12-23,36-47

@krasi-georgiev Thanks, i will look into it.

@brian-brazil
Copy link
Contributor

Try setting GOMAXPROCS to 12 or 24. The hyperthreads tend to result in the goroutines fighting each other a bit.

@godliness godliness changed the title Prometheus restart very slowly when the size of wal is huge Prometheus restart very slowly when the size of data folder is huge May 30, 2019
@godliness
Copy link
Author

godliness commented May 30, 2019

@brian-brazil
I hav tried this but there is no obvious effect.

I also take a further look into the code that reload and loadWAL both will takes about 10 minutes, not only loadWAL, reload will takes about 5 minutes, and loadWAL will take about 5 minutes also.

-storage.tsdb.retention=14d --storage.tsdb.max-block-duration=30m --storage.tsdb.min-block-duration=30m
data folder is  about 930G
wal folder is about 13G
index file in every block folder is about 1.5G (hundreds of blocks, as the `storage.tsdb.retention=14d` and `block-duration=30m`, set duration is 30m, as we wanna keep wal is small and make it faster when restart the prometheus)

Below i have two ways wanna to improve the restart speed:

  1. What about take a lazy reload when restart prometheus that means make reload operation running as a goroutine and only do loadWAL synchronously.

  2. Read the multi index of blocks concurrently by goroutines.

Do you have any ideas about these ideas?

@brian-brazil
Copy link
Contributor

reload should be extremely fast - and we need to wait on it in any case. Large indexes could explain it, that sounds kinda big.

@godliness
Copy link
Author

godliness commented May 30, 2019

@brian-brazil

Yes, index file is big, since our Kubernetes cluster has 1500 nodes and multi samples collected(also collect metrics of pods and nodes).
I will try to filter some inessential metrics.

I'm not sure why , but i will look the code again.

we need to wait on it in any case

Do you think this is a good way to reload multi blocks which index file is big?

Read the multi index of blocks concurrently by goroutines.

@godliness
Copy link
Author

godliness commented May 30, 2019

Closing this issue if it is not an issue for us, thanks for your help @brian-brazil @krasi-georgiev

@krasi-georgiev
Copy link
Contributor

reading the index in separate go routines is not a bad idea, but probably a lot of work to make it race conditions free. If anyone has the time to experiment would be happy to review a PR.

Sign up for free to subscribe to this conversation on GitHub. Already have an account? Sign in.
Labels
None yet
Projects
None yet
Development

No branches or pull requests

3 participants