Memory leak when request body is anything but JSON #2665
Comments
|
Also I don't think this is an issue in 1.3 because of the changes there to binding to raw bodies |
@jameskleeh I debugged our application by setting a breakpoint there but the code was never called. Is there already a snapshot / mileston release for 1.3? I would like to test our application with 1.3. |
|
@carlosbarragan Yes there are 2 milestones and snapshots for 1.3 |
|
Closing this due to a lack of feedback. If you can reproduce this issue with 1.3, please let me know and I'll reopen. |
|
We'll try to test with 1.3 as soon as possible. BTW, we noticed we cannot pass the body as |
|
We tested with 1.3 and, sadly, the memory leak is still there. Here are the stats: With 1.2.6 and passing the body as
With 1.3.0 and passing the body as
@jameskleeh please reopen as the problem still persists. |
|
I find it strange that the |
|
So far I took the example application and enabled paranoid level resource leak detection: @JvmStatic
fun main(args: Array<String>) {
ResourceLeakDetector.setLevel(ResourceLeakDetector.Level.PARANOID)Then created a <Session-Request><device-id>test1</device-id><device-context>test2</device-context></Session-Request>Then ran I observed that in the profiler there were indeed some byte buf objects records around and memory consumption went up to 800mb but they were placed in "Objects unreachable from GC roots but not yet collected" in YourKit. Running the app with a memory cap |
|
Within a debugger the bytebuf that produced the string was released here: I observed no leak messages from Netty's Other than GC pauses the application was never unavailable at any point. |
|
In the example app I monitored it via VisualVM and after a GC cycle no classes in |
|
We also tried to reproduce the bug locally using the real application and putting it under load, but we could not successfully reproduce it. We observed on production that the application starts consuming memory under load after some minutes ( > 30 mins). We have not tried to run it locally that long, but maybe this could help. We also have observed that the memory increases rapidly when the application is getting way too much load (10,000 req / min per Pod). With the normal load, it takes way longer for the memory consumption to increase |
@graemerocher I debugged a single request on our actual application and the |
|
@carlosbarragan Interesting. What we need is an example that reproduces that |
|
@graemerocher how can I provide an example without posting a real request due to privacy and NDA with our customer? I am open to do a video session with you or one of your team members if you believe this could help. Perhaps we are missing some configuration or something like that. |
|
I'm investigating some other approaches that moves that logic that calls |
|
Ok. FYI the application also has a Json API. I debugged a request to this API and the |
|
@carlosbarragan Can you try the |
|
@graemerocher it turns out, the Nevertheless, we noticed only the last request body we sent was being released. All other requests we sent before closing the client were not clean up. I don't know the internal workings of Netty but could it be that it reuses the same channel under load and therefore the channel never becomes inactive? This could lead to the situation where the requests are not properly released. |
|
@carlosbarragan does the snapshot resolve the issue? |
|
Haven’t tried yet. I’ll try it tomorrow morning |
|
@carlosbarragan I have pushed another potential fix since I am not 100% sure my first fix will solve the problem based on the information you supplied that is relates to persistent connections. If you can try the snapshot tomorrow that would be great. Thanks for collaborating on this. |
|
@graemerocher Im almost certain this problem is related to Keep-alive connections. I quickly verified and could confirm that the keep-alive header is there in our prod environment. |
|
Fix looks promising. I tested it locally with persistent connection and the request was correctly cleaned up. I will deploy it and give feedback as soon as possible. |
|
@graemerocher we deployed the fix and let it run for about an hour and it seems it works! Some stats of the application after running for 60 minutes:
Thank you very much for your quick support! |
|
Great news, thanks for the feedback |
Step to reproduce
The bug cannot be easily reproduced locally. However I have data that supports the problem at hand.
Some information about our application:
Our micronaut application runs in production on a K8s cluster and gets around 5K request per minute. We use kotlin and Reactor in our application.
We have been observing that the memory consumption increases with time and after around 6 hours the Pods need to be restarted by K8s because they are out of memory.
If the load increases, peaks etc., then the restart happens before 6 hours.
The application gets requests in XML and calls other services (using JSON) and does some Database (MongoDB) calls. Really nothing extraordinary. In order to handle the XML, we inject the body in the controller as a
Stringas follows:and afterwards we parse the request using the
XmlMapperfrom Jackson.Since the clients making the requests to the application are programmed in a way that they always expect an
HTTP 200, the application always returns200even if there are errors. That is also another reason why we parse the payload inside the controller (the first reason being lack of support for parsing XML directly by Micronaut), in order to handle exceptions that may happen when parsing the request.A link to a stripped down version of the applicaiton can be found at the bottom of this issue. Please notice that we removed a lot of code that was not necessary to describe our problem.
Analysis
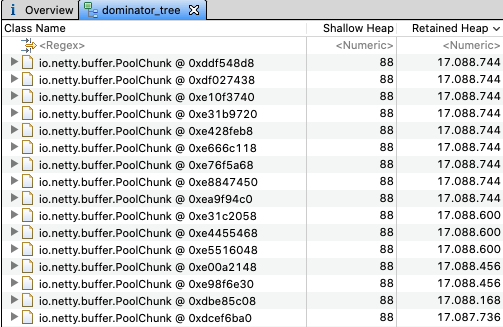
We did a memory dump analysis (see screenshot) and observed that obects of type
io.netty.buffer.PoolChunkwere consuming a lot of memory and, somehow, they weren't being released. These objects were actually holding the request body as seen in the screenshot (actual request is not shown in full due to privacy agreement with our customer). The screenshot was taken around 30 minutes after deployment. We observed that these objects were accumulating during the livespan of the application and therefore were the cause of the high memory consumption that leads to the Pods being restarted by K8s every 6 hours.Objects in Heap
Content of the
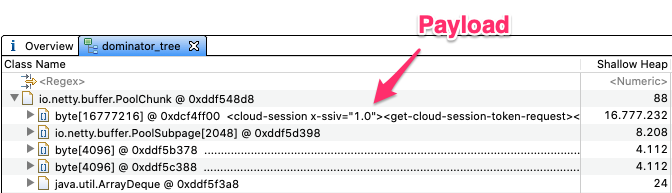
PoolChunkobjectWe also observed several log statements as follows:
LEAK: ByteBuf.release() was not called before it's garbage-collected.We tried our best to reproduce the problem locally. To do that we needed to create similar load as in production. That was not the difficult part. The problem was that we did not want to stress-load the other systems that were being called by the application for a long time, therefore it was not possible for us to reproduce the bug locally.
At this point in time our assumption was that most of the request bodies were not being collected by GC but we didn't know why.
However, while doing a debug session, with a lot of breakpoints all over the place, suddenly the Netty leak detector was called and we could determine the exact location of the leak (see screenshot). We were testing with several requests and we noticed one request failed because one of the external services responded with error. We then execute the exact same request and then, the leak detector was called. Could it be that the error of the external service caused Netty not to clean up the request?
Netty Leak detector:

The location of the reported leak was the
ByteBufConverters. Apparently, the convereter transforms aByteBufferinto aStringbut it never releases theByteBuffer. After further investigation, we found out that when Micronaut processes a JSON payload, it does release the payload. In the classJsonContentProcessormethodonData()you can find the follwoing code:So, it looks like Micronaut reads the payload from the ByteBuffer, parses it and then releases the ByteBuffer afterwards. That does not happen with any other kind of payload or at least we could not find it.
That piece of code gave us the idea for our workaround
Workaraound
Instead of injecting the body as
String, we inject it as aCompositeByteBuf. By doing this, Micronaut does not do any kind of conversion, so we got the payload as is and we get the contents in a similar way like theJsonContentProcessormeaning, we read theByteBufferand release it ourselves afterwards:The
releaseAndGetString()extension function is implemented as follows:We applied this workaround and deployed to production and since then everything is running smoothly. No Pods restarts in the last 5 days and memory consumption remains stable at around 200 MB of heap. We think, this is a strong indicator that the payload was not being properly realeased either by Micronaut or by Netty.
Expected Behaviour
No memory leaks should happen when injecting a body that is not json. If the developer is expected to take care of releasing the
ByteBufferit should be documented that way.Environment Information
openjdk:11-jdk-slim-stretchExample Application
https://github.com/carlosbarragan/micronaut-memleak-example
The text was updated successfully, but these errors were encountered: