Skip to content
New issue

Have a question about this project? Sign up for a free GitHub account to open an issue and contact its maintainers and the community.

By clicking “Sign up for GitHub”, you agree to our terms of service and privacy statement. We’ll occasionally send you account related emails.

Already on GitHub? Sign in to your account

Visualization #103

Open
takacsg84 opened this issue May 10, 2022 · 3 comments
Open

Visualization #103

takacsg84 opened this issue May 10, 2022 · 3 comments

Comments

@takacsg84
Copy link

Hi there! Is there a best practice to visualize this format of AST?
Thank you!

@lelit
Copy link
Owner

lelit commented May 10, 2022

Sorry, what do you mean? What do you want to visualize and what is this format of AST?

@takacsg84
Copy link
Author

Sorry for the ambiguous question.
I would like to achieve something like this:
https://shardingsphere.apache.org/document/current/img/sharding/sql_ast.png
And by "this format" of AST what i mean is any output that I can get by using pglast package on a valid SQL query.

@lelit
Copy link
Owner

lelit commented May 10, 2022

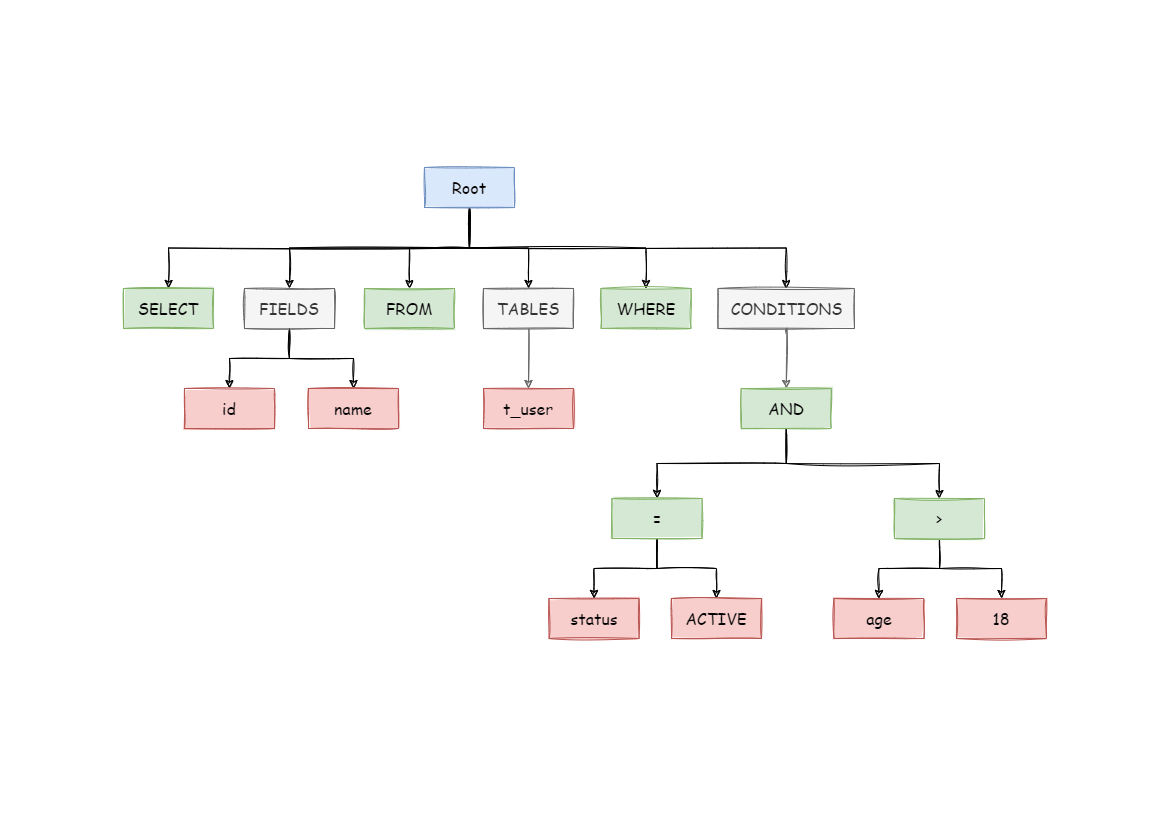
Interesting, but no, there's nothing similar, and it's not trivial to obtain that, although probably doable with some effort, for example as an alternative set of printer functions that emits dot syntax....

The main problem I foresee is how to tag the various pieces... I mean, in that picture you see fields as a tag of id and name, but what should happen when the query is not trivial, and the fields are actually subselects, or expressions?

Sign up for free to join this conversation on GitHub. Already have an account? Sign in to comment
Labels
None yet
Projects
None yet
Development

No branches or pull requests

2 participants