Observability: Metrics Support #8490
Replies: 13 comments 36 replies
-
|
For a Keycloak installation with a large number of realms, or large number of clients. Having separate tags would quickly make the metrics endpoint return a very large set. Would it make sense to have some high-level options like "enablePerRealmMetrics", and "enablePerClient" metrics? |
Beta Was this translation helpful? Give feedback.
-
|
Is it a problem that metrics endpoint is available on the same URL/PORT as everything else? How do we prevent "unauthorized" access to metrics? |
Beta Was this translation helpful? Give feedback.
-
|
cant metric be exposed on management port ?(if i remember correct wildfly based keycloaks does it that way) |
Beta Was this translation helpful? Give feedback.
-
|
also, there if we use the custom keycloak metrics aerogear keycloak-metrics-spi, the keycloak metrics are available in /realms/metrics and the native quarkus metrics are available at /q/metrics these should be consolidated, else it becomes painful to scrape the metrics from muliple sources for same pod/deployment. |
Beta Was this translation helpful? Give feedback.
-
|
Hello Stian,
In latest Quarkus versions metrics are exposed via the `/q` endpoint, e.g.
/q/metrics as the other quarkus related management endpoints.
So we need a way to protect those `/q` endpoints. Other frameworks like
Spring Boot allow to expose the "actuator" / management endpoints on a
different port with custom security.
We could add a custom filter that allows basic auth / bearer authentication
for accessing /q oder sub-resources.
Perhaps the Quarkus team has some more options here.
Cheers,
Thomas
…On Wed, 29 Sept 2021 at 11:45, Stian Thorgersen ***@***.***> wrote:
Is it a problem that metrics endpoint is available on the same URL/PORT as
everything else? How do we prevent "unauthorized" access to metrics?
—
You are receiving this because you authored the thread.
Reply to this email directly, view it on GitHub
<#8490 (comment)>,
or unsubscribe
<https://github.com/notifications/unsubscribe-auth/AACM2QQCZHHGXOVJLZNAVJDUELN43ANCNFSM5E3TUTVA>
.
|
Beta Was this translation helpful? Give feedback.
-
Beta Was this translation helpful? Give feedback.
-
|
By the way I also don't want to expose Quarkus too much, so would be good to have a different endpoint to '/q', not sure if Quarkus let's us configure that? Also, would be perhaps an idea to have metric names like "keycloak.http..." rather than "quarkus.http"? |
Beta Was this translation helpful? Give feedback.
-
|
Micrometer uses |
Beta Was this translation helpful? Give feedback.
-
|
It should be possible to change the relative path for endpoints. We have done that for the current implementation using microprofile/smallrye. |
Beta Was this translation helpful? Give feedback.
-
|
Will it be possible to add Open Telemetry support (https://quarkus.io/guides/opentelemetry)? Open Telemetry can be used for tracing/metrics/logs and it might be commonly accepted observability standard in near future. That may eliminate also problem with metric endpoint - it won't be needed. User just configure Open Telemetry collector (exporter) to own tracing/metrics/logs processing tools (e.g Prometheus, AWS X-Ray, Jaeger, ...). |
Beta Was this translation helpful? Give feedback.
-
@jangaraj Looks like you are not using the open telemetry extension from Quarkus, right? To be honest, I have never worked with OTEL before and I don't know how far your initial approach differs if you were using the extension. Perhaps one of the main drawbacks of not using the extension is that we should not be able to plug in/register our own metrics? |
Beta Was this translation helpful? Give feedback.
-
|
@pedroigor My current attempt uses java agent jar from https://github.com/open-telemetry/opentelemetry-java-instrumentation with custom How can I enable Quarkus native opentelemetry in doesn't work: It looks like Quarkus native opentelemetry is available from Quarkus 2+, so it may not be possible to run it with |
Beta Was this translation helpful? Give feedback.
-
|
To make this work we would need to include otel extensions into the distribution. Otherwise, those properties are going to be ignored. That is why I raised a question to you guys asking whether we should enable micrometer or otel, but not necessarily both. It might be possible to include Quarkus extensions directly to the distribution too, but that is something I need to look at more closely because I'm not 100% if this is supposed to work. |
Beta Was this translation helpful? Give feedback.
-
|
Micrometer provides metrics. OTEL provides traces (and hopefully in the future also metrics/logs). So I would say there is use case for both. |
Beta Was this translation helpful? Give feedback.
-
|
Having trace support would be fantastic. |
Beta Was this translation helpful? Give feedback.
-
Beta Was this translation helpful? Give feedback.
-
|
Woops, realized Stian already made this point. Deleting to prevent noise :) |
Beta Was this translation helpful? Give feedback.
-
|
Seems great! I think it's calculated with different polls of #user counter |
Beta Was this translation helpful? Give feedback.
-
|
@thomasdarimont I would like to add metrics for all events to the mix. |
Beta Was this translation helpful? Give feedback.
-
|
One point especially interesting for our setup is measuring outbound request times. We have a few SPIs that make external HTTP requests. Currently, we have some limited metrics for those based on the smallrye/microprofile integration in WildFly. However, these have at least one limitation that currently makes those metrics a bit less useful, especially when Keycloak is deployed as a cluster and not as a single node. Microprofile's Histogram and Timer metrics both have a type (openmetrics/prometheus) of "summary", and immediately calculate the percentiles on the client. Aggregating these values across multiple nodes is not really possible. There seems to be little movement in microprofile to support this since 2020: smallrye/smallrye-metrics#325 Micrometer allows outputting the actual histogram data, and even states that this is the preferred approach if the system in question supports these aggregations: https://micrometer.io/docs/concepts#_histograms_and_percentiles |
Beta Was this translation helpful? Give feedback.
-
|
I would say that tracing/logging will be usefull here. It is your SPI, so you can generate trace/log for each outbound request and then aggreagate them (min/max/avg/percentiles/...) in your tracing/logging tool (also accros multiple nodes) - eventually you may generate metrics from them. |
Beta Was this translation helpful? Give feedback.
-
|
Has there been any progress on this? Is this part of a roadmap or is there a list of suggested metrics yet? We're trying to make a decision on whether to spend more time maintaining the keycloak-metrics-spi or rather advice users to rely on native Keycloak metrics. |
Beta Was this translation helpful? Give feedback.
-
|
@sschu how would that work for metrics that are not persisted in the database, like request duration or status codes? We are dealing with the same issue in the metrics SPI by pushing to a common collector instead of scraping (https://github.com/aerogear/keycloak-metrics-spi#pushgateway). |
Beta Was this translation helpful? Give feedback.
-
|
@pb82 I would not expose them externally. For me, there is one set of metrics that is useful to operate Keycloak i.e. SLIs, memory consumption etc. I would not expose them externally per realm but centrally at a single metrics endpoint. I would only expose business metrics like number of users, logins, etc. externally per realm. |
Beta Was this translation helpful? Give feedback.
-
|
@sschu - metrics are usually best collected via a time series database, and Keycloak's SQL databases are not well designed for that as metrics are append only. |
Beta Was this translation helpful? Give feedback.
-
|
It depends on what you want to measure. For business metrics like number of users, number of clients, etc. going to the database is straight-forward. |
Beta Was this translation helpful? Give feedback.
-
For small datasets, it might be straight-forward. For larger dataset it is problematic, counting the number of users per realm every 60 seconds would be quite a performance hit.
The new store doesn't have something you ask for on its road map. Metrics are no entity per se for the new store. The new store only cares about users, group, roles, clients etc. Today one can use the events to collect custom metrics to fill the gaps we have in the Keycloak metrics, and a future version of Keycloak might have these metrics on node based activities. Keycloak allows for custom endpoints, and one of those could wrap the metrics stored in a Prometheus instance (or different tool) to show an aggregated view. So while the metrics generation side will and need to improve over time, exposing of the metrics as you would like to see it will be a custom solution that can be built with the APIs and tools available today in Keycloak and its ecosystem. // cc: @hmlnarik |
Beta Was this translation helpful? Give feedback.
-
|
@sschu Even though not aggregated they have value. I would start exposing those metrics (if enabled) as they did. People can still aggregate using some external tool, right? The reason why I'm in favor of having those metrics as they are is that people are using them. I would say quite often. |
Beta Was this translation helpful? Give feedback.
-
|
I guess external aggregation will be tricky. With a load balancer in front you will need several requests to get all data for aggregation. That depends on the load balancer strategy - it could be round robin but also something more sophisticated like session-stickiness that would need workarounds. Once you visited all nodes, you would still need to detect you actually got data from different nodes - but this should be possible by adding tags I assume. |
Beta Was this translation helpful? Give feedback.
-
|
@sschu I agree that external aggregation is tricky with a load balancer involved. How about internal aggregation? It could be an exporter service that scrapes from all Keycloak instances and exposes one metrics endpoint with the aggregated results. This could be managed by the Keycloak Operator. Or users themselves if if is sufficiently documented. |
Beta Was this translation helpful? Give feedback.
-
|
Hello, We create a few dashboards[1] for the REST API using Dashbuilder[2] and we are looking for the metrics endpoint to build more dashboards.
For dashbuilder it would be fine to only have the metrics for now because it can consume metrics directly;
I think Prometheus could be helpful in this case. We would like to contribute with some dashboards when the metrics endpoints is enabled. Thanks! [1] https://github.com/pedro-hos/keycloak-dashbuilder |
Beta Was this translation helpful? Give feedback.
-
|
Thanks @thomasdarimont for pointing this out. I am already thinking about a meaningful grouping of endpoints for metrics. I'll have a look. |
Beta Was this translation helpful? Give feedback.
-
|
@stianst @pedroigor Since the memory exhaustion problem @thomasdarimont mentioned might be a real problem, I am wondering whether we should really disable the HTTP metrics for now as Thomas suggested and also put this into the KC 21.0.1 patch release? |
Beta Was this translation helpful? Give feedback.
-
|
@sschu / @thomasdarimont - creating a GitHub issue would be a start. Depending on how fast we can determine the cause and fix it, that issue should either fix the cause, or should disable the http metrics. Please ping me on the issue and any PR, and I'll help to get it merged and backported. |
Beta Was this translation helpful? Give feedback.
-
|
@ahus1 @sschu I just filed an enhancement request for this: #17281 |
Beta Was this translation helpful? Give feedback.
-
|
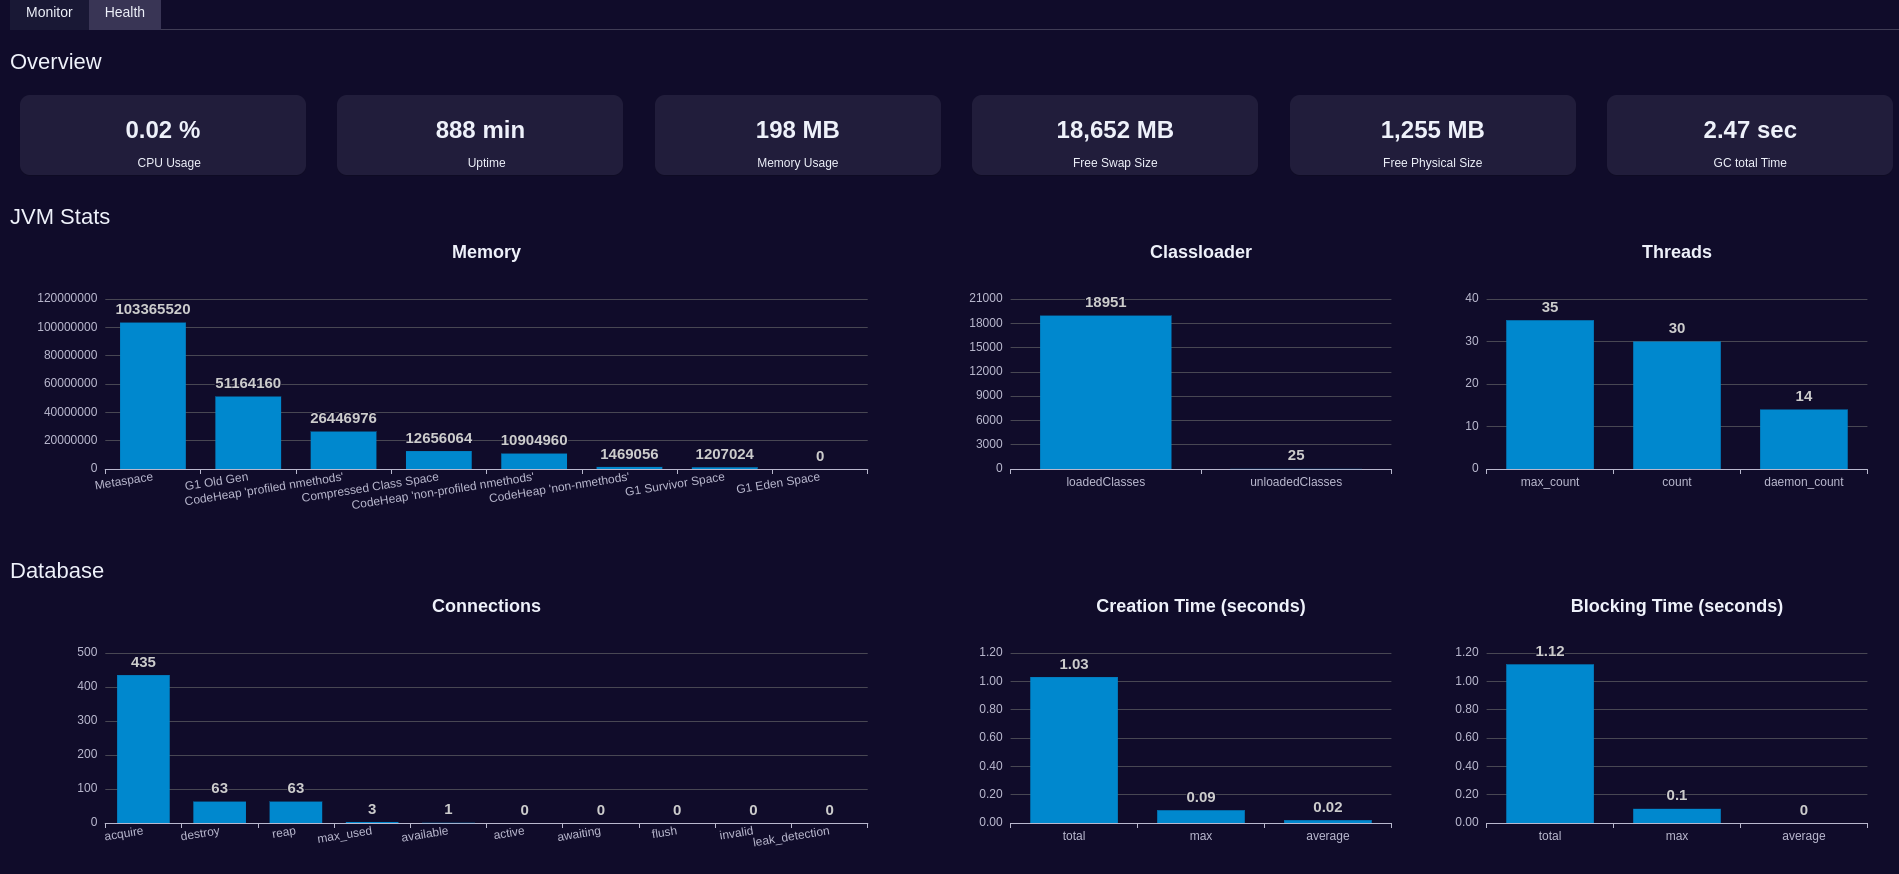
Hello,
Thanks for pointing us to this endpoint. We tested it and it seems to work well. My colleague @pedro-hos recently created a monitoring APP and added a new metrics dashboard based on this endpoint https://github.com/pedro-hos/keycloak-dashbuilder
|
Beta Was this translation helpful? Give feedback.
-
|
Another metric that would be helpful is "OIDC/SAML artifact generation duration" by client
This would help to uncover long running protocol mappers. The same could be applied to LDAP/UserFederation mappers by federation-provider as well as IdP Broker mappers by identity-provider. |
Beta Was this translation helpful? Give feedback.
-
|
Perhaps, for a good starter and not too overblow this feature request, but to start finally some implementation, I suggest to implement first a few common metrics, which most of my customers want to see ootb:
All of the above metrics should have the info of the respective realm and client, if possible. /cc @ahus1 |
Beta Was this translation helpful? Give feedback.
-
The book “Distributed Systems Observability'' by Cindy Sridharan describes logs, distributed tracing and metrics as
essential telemetry types to monitor an application in production, which are also known as the “three pillars of observability”.
Currently Keycloak does not provide metrics out of the box and users who want to have metrics need to use extensions like
the aerogear keycloak-metrics-spi or implement their own metrics collection based on the smallrye-metrics support provided by the Wildfly and JBoss EAP runtimes.
It would be very helpful for operations teams if Keycloak had a compelling set of useful metrics built-in.
The goal of this discussion is to shape the metrics part of Keycloak’s observability story with focus on Keycloak.X and to compile the foundation for a new metrics design document.
Metrics
A metrics based monitoring of a Keycloak system could consist of interesting metrics that are relevant for different
audiences like operations and SRE, as well as product teams.
Some of those metrics provide information about different layers of a system, including:
Keycloak Metrics
The application layer of a Keycloak system can provide many different metrics that could be arranged in a set of
logical domains. Some of the following metrics might be coarse grained while others could be broken down further
by additional context data, e.g. realm, error_code, client_id, authenticator_execution, or protocol.
The following list serves as an example for high-level metrics that could theoretically be provided by Keycloak
at some point in time.
The metrics listed below are based on an earlier discussion about a compilation of metrics for Keycloak.
Model Metrics
Represents the system inventory, and denotes how many items of a particular type exist in the system.
This helps to keep an eye on the growth of the system.
Example metrics:
Authentication Metrics
Represents authentication activity for users and clients.
Example metrics:
Authorization Metrics
Represents Authorization activity collected for the authz services.
Example metrics:
User Metrics
Represents information about users and their metadata.
Example metrics:
Client Metrics
Represents information about clients and their metadata.
Example metrics:
OIDC Protocol Usage Metrics
Usage information about the OIDC protocol
Example metrics:
SAML Protocol Usage Metrics
Usage information about the SAML protocol
Example metrics:
Federation Metrics
Information about user federation
Example metrics:
Identity Brokering Metrics
Information about Identity Brokering
Example metrics:
Inbound / Endpoint Metrics
In micrometer those are usually captured by the dimensional metric
http.server.requests{uri=...,status=...,...}.Outbound Metrics
In micrometer those are usually captured by the dimensional metric
http.client.requests{uri=...,status=...,...}.Instance Metrics
Represents general information and metadata about the server.
Some of those “metrics” are just simple gauges with a dummy value that exposes the actual metadata via labels.
Example metrics:
Metrics Infrastructure
The Wildfly and JBoss EAP based Keycloak / RH SSO distributions use SmallRye metrics for their runtime metrics collection.
However the Quarkus team recommends using micrometer for a while now for custom metric collection. In order to follow this approach we will focus on micrometer based metrics for the new metrics support in Keycloak.X.
OS, Process and JVM based metrics are usually provided by the base metric libraries.
In our case the micrometer library provides a set of useful JVM and system metrics out of the box: https://micrometer.io/docs/ref/jvm
The micrometer Keycloak metrics SPI provides some additional metrics that could be useful.
Metrics instrumentation
Keycloak provides several ways to collect metrics synchronously, e.g.: event listeners, JAX-RS / container specific filters and HTTP client interceptors. Metrics that are more expensive to compute could be collected
asynchronously by a dedicated metrics service that can execute datastore specific queries.
Collected metrics could either be directly stored in the micrometer metric registry or buffered in an own data structure that periodically releases the metrics into an underlying registry.
Explicitly computed metrics could be represented as
Gaugesthat are explicitly updated.Counted metrics like number of logins or failed logins could be recorded via
Countersthat are updated viaevent listeners or request filters / interceptors.
Metrics around HTTP request processing should capture information about the request path, status code
and request durations. Additionally request duration recording should allow to track latency profiles.
Keycloak could provide components that enable metrics collection on multiple levels:
Those metric components should access a shared metric registry, which holds the metadata and state that is eventually exposed by dedicated metric endpoints.
Keycloak Metrics
Initial Metrics Selection
Although many of the metrics mentioned above provide valuable insights about a Keycloak system, we should focus
on a small initial subset of metrics that are provided out of the box.
Built-in Metrics
Some core metrics should be built-in to Keycloak and provide some configuration options, like whether the metric is collected at all, or the granularity, e.g. additional tags, labels to add.
Custom Metrics
Some of the metrics mentioned above could be provided out of the box by Keycloak, however there will be use-cases that can not be foreseen, which require the ability to contribute custom metrics to the system.
For this Keycloak needs to provide a metrics SPI that enables users to add their own custom metrics.
Metrics Configuration
We should have a way to let users control which metrics are collected / tracked by Keycloak.
Users should be able to control things like:
Exposing Metrics
Metrics need to be accessible for metric collection tools like Prometheus or InfluxDB. Those tools usually fetch metrics information from an HTTP endpoint. For this we could either provide one global metrics endpoint for the whole server and all realms or realm specific endpoints that can be consumed by the collectors. This model is supported by Quarkus out of the box via the
/q/metricsglobal endpoint. This endpoint could then contain information about the process, jvm, instance, as well as all the Keycloak application metrics.However in environments where a Keycloak system is shared among multiple different parties, e.g. a collection of realms per tenant model, users might only be allowed to access a subset of the metrics information via realm specific endpoints that provides only metrics for a particular realm. In this case an endpoint like
/auth/realm/$myrealm/metricscould be used as a realm specific endpoint that only provides the Keycloak application metrics and perhaps a small subset of server metadata.Note, that it should be possible to protect the endpoints which expose realm metrics.
Metrics SPI
A metrics SPI should allow users to contribute new metrics to the Keycloak metrics collection.
The registered metrics could hook into the metrics collection infrastructure described above.
Links
Questions
Beta Was this translation helpful? Give feedback.
All reactions