Estimated Time: ~15 minutes
This document provides a step-by-step walkthrough on how to setup Lighthouse CI on your repository. After this guide, your build system will be running Lighthouse on your project's URLs on every commit, automatically asserting that important Lighthouse audits pass, and uploading the reports for manual inspection.
Important Note Before Starting
Introducing performance measurement to a project for the first time can have a fairly steep learning curve. Lighthouse team recommends starting slowly. Refer to the recommended configurations documentation for advice on where to start based on your experience level and the project's maturity if you run into any issues.
Your project should meet the following requirements:
- Source code is managed with git (GitHub, GitLab, Bitbucket, etc).
- Branches/pull requests are gated on the results of a continuous integration build process (Travis CI, CircleCI, Jenkins, AppVeyor, GitHub Actions, etc). If you aren't using a build process yet, Travis CI offers free continuous integration for open-source projects.
- Your CI process can build your project into production assets (typically provided as an
npm run buildcommand by most JavaScript frameworks). - Your project either: A) has a command that runs a web server with production-like assets. B) is a static site.
The below travis config will automatically find your project's static assets, run Lighthouse 3 times on each HTML file, and upload the reports to temporary public storage where they'll be accessible to anyone with the URL.
NOTE: As the name implies, this is temporary and public storage. If you're uncomfortable with the idea of your Lighthouse reports being stored on a public URL on Google Cloud, skip to the add assertions or Lighthouse CI server steps. Reports are automatically deleted 7 days after upload.
.travis.yml
# dist: xenial (the default) or newer required
language: node_js # Node 10 LTS or later required
addons:
  chrome: stable # make Chrome available
before_install:
  - npm install -g @lhci/cli@0.3.x # install LHCI
script:
  - npm run build # build your site
  - npm test # run your normal tests
after_success:
  - lhci autorun --upload.target=temporary-public-storage # run lighthouse CI against your static site
Github Actions
name: Build project and Run Lighthouse CI
on: [push]
jobs:
  lhci:
    name: Lighthouse CI
    runs-on: ubuntu-latest
    steps:
      - uses: actions/checkout@v1
      - name: Use Node.js 10.x
        uses: actions/setup-node@v1
        with:
          node-version: 10.x
      - name: npm install, build
        run: |
          npm install
          npm run build
      - name: run Lighthouse CI
        run: |
          npm install -g @lhci/cli@0.3.x
          lhci autorun --upload.target=temporary-public-storage || echo "LHCI failed!"
Circle CI
version: 2.1
jobs:
  build:
    docker:
      - image: circleci/node:10.16-browsers
    working_directory: ~/your-project
    steps:
      - checkout
      - run: npm install
      - run: npm run build
      - run: sudo npm install -g @lhci/cli@0.3.x
      - run:
          name: lhci autorun
          command: lhci autorun --upload.target=temporary-public-storage || echo "LHCI failed!"
GitLab CI
NOTE: If you have the ability to run your jobs under a different user, you can avoid --no-sandbox by creating a Chrome usergroup.
image: cypress/browsers:node10.16.0-chrome77
lhci:
  script:
    - npm install
    - npm run build
    - npm install -g @lhci/cli@0.3.x
    - lhci autorun --upload.target=temporary-public-storage --collect.settings.chromeFlags="--no-sandbox" || echo "LHCI failed!"
Jenkins (Ubuntu-based)
machine-setup.sh
#!/bin/bash

set -euxo pipefail

# Add Chrome's apt-key
echo "deb [arch=amd64] http://dl.google.com/linux/chrome/deb/ stable main" | sudo tee -a /etc/apt/sources.list.d/google.list
wget -q -O - https://dl.google.com/linux/linux_signing_key.pub | sudo apt-key add -

# Add Node's apt-key
curl -sL https://deb.nodesource.com/setup_10.x | sudo -E bash -

# Install NodeJS and Google Chrome
sudo apt-get update
sudo apt-get install -y nodejs google-chrome-stable
job.sh
#!/bin/bash

set -euxo pipefail

npm install
npm run build

export CHROME_PATH=$(which google-chrome-stable)
export LHCI_BUILD_CONTEXT__EXTERNAL_BUILD_URL="$BUILD_URL"

npm install -g @lhci/cli@0.3.x
lhci autorun --upload.target=temporary-public-storage
That's it! With this in place, you'll have Lighthouse reports collected and uploaded with links to each report.
Temporary public storage provides access to individual reports, but not historical data, report diffing, or build failures. Read on to find out how to add assertions, configure the Lighthouse CI server for report diffs and timeseries charts, and enable GitHub status checks.
NOTE: If your site isn't static or requires a custom webserver of some sort, refer to the autorun docs for more on how to configure LHCI to integrate with your server.
NOTE: If you're new to performance measurement or your site has a lot of room for improvement, we recommend skipping this step for now and revisiting once your Lighthouse scores are a little higher.
While Lighthouse reports at your fingertips is great, failing the build based on the audit results is even better! Add an assertion preset option to get started with assertions.
script:
  - npm run build # build your site
  - npm test # run your normal tests
  - lhci autorun --assert.preset=lighthouse:recommended # run Lighthouse CI on your static site and assert the recommended preset
NOTE: the lhci autorun command moved from after_success to script in this example because we'd like the exit code of lhci to fail the build. If you're using another CI provider you can remove the || echo "LHCI failed!".
The setup so far will automatically assert the Lighthouse team's recommended set of audits, but your project might have a bit of work to go before hitting straight 100s! Fear not, the assertions are completely configurable and you can disable as many audits as you need. Read more about what's possible in configuration with the assertions format.
Lighthouse CI uses a lighthouserc.json file to configure all the core commands used. You can replace the options on the command-line we've seen so far with the following configuration file. Read more about how to configure Lighthouse CI in our docs.
# no need to pass explicit options
# lighthouserc.json will be automatically picked up if it's in the cwd
lhci autorun
lighthouserc.json
{
  "ci": {
    "collect": {
      "numberOfRuns": 3
    },
    "assert": {
      "preset": "lighthouse:recommended",
      "assertions": {
        "offscreen-images": "off",
        "uses-webp-images": "off"
      }
    },
    "upload": {
      "target": "temporary-public-storage"
    }
  }
}The setup so far will fail builds through your CI provider, but there's no differentiation between the build failing because of Lighthouse CI versus your other tests. Links to the Lighthouse report are also tucked away in your build logs.
GitHub status checks add additional granularity to your build reporting and direct links to uploaded reports within the GitHub UI!

To enable GitHub status checks via the official GitHub app, install and authorize the app with the owner of the target repo. If the repo is within an organization, organization approval might be necessary. Copy the token provided on the authorization confirmation page and add it to your build environment as LHCI_GITHUB_APP_TOKEN. The next time your lhci upload command runs it will also set the results as GitHub status checks!
Be sure to keep this token secret. Anyone in possession of this token will be able to set status checks on your repository.
If you don't want to use the Github App, you can enable this via a personal access token. The only difference is that your user account (and its avatar) will post a status check. Create a token with the repo:status scope and add it to your environment as LHCI_GITHUB_TOKEN.
Be sure to keep this token secret. Anyone in possession of this token will be able to set status checks on your repository.
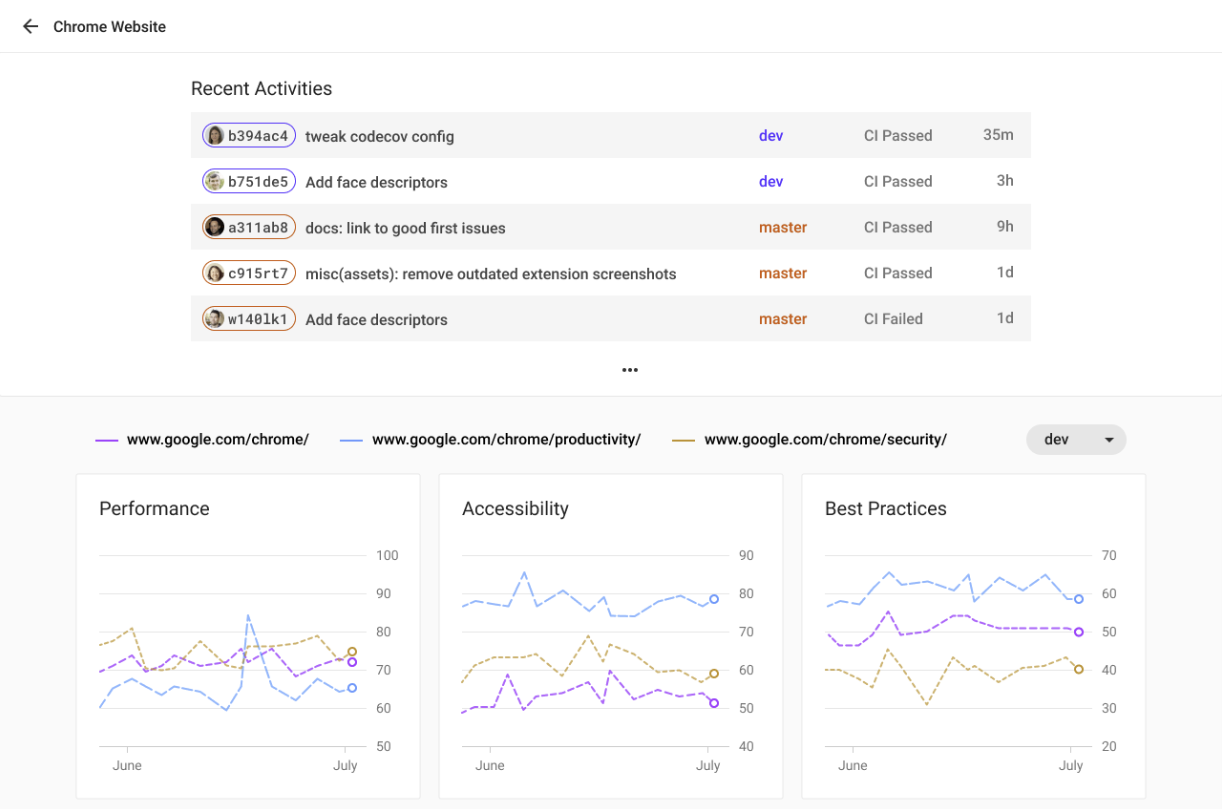

Historical reports and advanced report diffing is available with the Lighthouse CI server. For setup of the server itself, see our server recipe.
Once the server is set up, create a a new project with the lhci wizard:
$ lhci wizard
? Which wizard do you want to run? new-project
? What is the URL of your LHCI server? https://your-lhci-server.example.com/
? What would you like to name the project? My Favorite Project
? Where is the project's code hosted? https://github.com/GoogleChrome/lighthouse-ci

Created project My Favorite Project (XXXXXXXX-XXXX-XXXX-XXXX-XXXXXXXXXXXX)!
Use token XXXXXXXX-XXXX-XXXX-XXXX-XXXXXXXXXXXX to connect.
Add your token to your CI with the environment variable LHCI_TOKEN. Alternatively, you can pass it to upload with the --token flag:
lhci autorun --upload.serverBaseUrl="https://your-lhci-server-url.example.com" --upload.token="$LHCI_SERVER_TOKEN"
This token is only semi-secret in 0.3.x. Anyone with HTTP access to the server will already be able to view and create data as it is unauthenticated.
NOTE: If you run a matrix of environments in your tests, make sure you only run lhci autorun ONCE per build. The Lighthouse CI server will only accept a single upload per hash and future attempts to upload data for that hash will be rejected.