Reverse step-plot #5606
Labels
Comments
|
@Juerd can you please include an example (image) that shows what is the present state and what is the expected state, so that it is easier to understand this? |
|
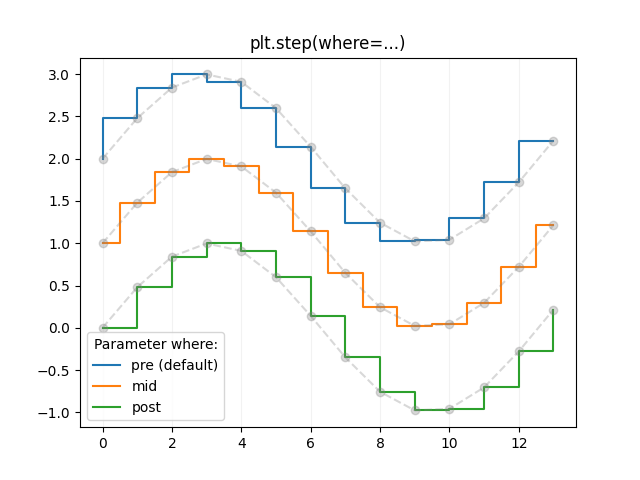
I also would appreciate this ... I will call it, feature. I can give you an example strait out of the matplotlib documentation: |
Sign up for free
to join this conversation on GitHub.
Already have an account?
Sign in to comment
The current implementation of the step-plot visualization appears to predict the future: a data point begins a new horizontal line which stays at that value, until it is obsoleted by a new value. I'd like chronograf to draw the horizontal line based on the y-position of the next data point instead. Whether this issue is a feature request or a bug report, depends on whether predicting the future was the intended behavior :)
Especially in the case where pulse-based output is given, for example in energy usage metering, the calculated value will generally be the average for the period that has elapsed since the previous pulse. In this case, the horizontal line's position should be determined by the data point that follows it, instead of the one preceding. Indeed this means that the last horizontal segment from the last known data point until the current point in time, can't be drawn.
In the tool that I'm migrating away from in favor of a more modern TICK stack, rrdtool, only has the "describe the past" functionality, and the sensors I'm using are incapable of predicting the future. Any value coming from them describes the preceding interval, as opposed to the value at the time of the pulse, or the interval that comes after.
Since there may be use cases where a data point does indeed describe the value from that point forward, instead of backward, it would probably be best if the behavior is made configurable.
I'm using chronograf from the Debian package, version 1.8.5-1, on Debian Buster 10.4.
The text was updated successfully, but these errors were encountered: