Skip to content
New issue

Have a question about this project? Sign up for a free GitHub account to open an issue and contact its maintainers and the community.

By clicking “Sign up for GitHub”, you agree to our terms of service and privacy statement. We’ll occasionally send you account related emails.

Already on GitHub? Sign in to your account

Hazelcast 4.0 Memory Leak Detected #16672

Closed
pkgonan opened this issue Feb 19, 2020 · 9 comments
Closed

Hazelcast 4.0 Memory Leak Detected #16672

pkgonan opened this issue Feb 19, 2020 · 9 comments
Assignees
Labels
Source: Community PR or issue was opened by a community user Team: Core
Milestone

Comments

@pkgonan
Copy link

pkgonan commented Feb 19, 2020

Hazelcast 4.0 memory leak detected.

First, i setup Hazelcast 4.0 only one instance server in aws elastic beanstalk.
Memory usage increased even though doing nothing.
Not connected any client, and did not touch anything.

Second, setup Hazelcast 3.12.6, it does not increased memory looks like hazelcast 4.0 memory pattern.

[Hazelcast 4.0 Memory Pattern]
Hazelcast 4 0 Memory Pattern

[Hazelcast 4.0 Memory Pattern About 4 Days]
Hazelcast 4 0 Memory Pattern About 4 Days

[Hazelcast 3.12.6 Memory Pattern]
Hazelcast 3 12 6 Memory Pattern

[About JVM Memory Analysis]
I analyzed heap dump, and there are too many unreachable objects founded.
Unreachable objects are 99.6 percentage of total heap size, and they seems not collected by garbage collector.

[1. Temporary Share Link]
https://heaphero.io/my-heap-report.jsp?p=YXJjaGl2ZWQvMjAyMC8wMi8xOS8tLWhlYXBkdW1wLmhwcm9mLTE2LTQ4LTQ5Lmpzb24tLQ==

[2. PDF file]
heapReport-2020-02-20-01-50.pdf

[Config File]

import com.google.common.collect.ImmutableMap;
import com.google.common.collect.Sets;
import com.hazelcast.config.*;
import com.hazelcast.config.cp.CPSubsystemConfig;
import com.hazelcast.config.cp.FencedLockConfig;
import com.hazelcast.config.matcher.WildcardConfigPatternMatcher;
import com.hazelcast.spi.properties.ClusterProperty;
import org.springframework.core.env.Environment;

import java.util.Arrays;
import java.util.Set;
import java.util.concurrent.TimeUnit;
import java.util.stream.Collectors;

final class HazelcastServerConfigure {

    private static final Set<String> AWS_PROFILES = Sets.newHashSet("dev", "qa", "stage", "live");

    private final HazelcastConfig.AwsConfig awsConfig;

    private final Environment environment;

    private final Config config;

    HazelcastServerConfigure(final HazelcastConfig.AwsConfig awsConfig, final Environment environment) {
        this.awsConfig = awsConfig;
        this.environment = environment;
        this.config = new Config();
    }

    private void setPropertyConfig() {
        config.setProperty(ClusterProperty.CACHE_INVALIDATION_MESSAGE_BATCH_ENABLED.getName(), "false");
    }

    private void setClusterNameConfig() {
        if (isAws()) {
            config.setClusterName(awsConfig.getEnvironmentName());
        }
    }

    private void setInstanceNameConfig() {
        config.setInstanceName(awsConfig.getEnvironmentName());
    }

    private void setJoinConfig() {
        if (isAws()) {
            final JoinConfig joinConfig = config.getAdvancedNetworkConfig().getJoin();

            joinConfig.getMulticastConfig()
                    .setEnabled(false);

            joinConfig.getTcpIpConfig()
                    .setEnabled(false);

            joinConfig.getAwsConfig()
                    .setEnabled(true)
                    .setUsePublicIp(false)
                    .setProperty("region", awsConfig.getRegion())
                    .setProperty("tag-key", ELASTIC_BEANSTALK_ENVIRONMENT_NAME_KEY)
                    .setProperty("tag-value", awsConfig.getEnvironmentName())
                    .setProperty("iam-role", awsConfig.getIamRole())
                    .setProperty("hz-port", "5701-5701");
        }
    }

    private void setPartitionGroupConfig() {
        config.getPartitionGroupConfig()
                .setEnabled(true)
                .setGroupType(PartitionGroupConfig.MemberGroupType.PER_MEMBER);
    }

    private void setCacheConfig() {
        config.setCacheConfigs(ImmutableMap.of("*", new CacheSimpleConfig()
                .setStatisticsEnabled(true)
                .setManagementEnabled(false)
                .setInMemoryFormat(InMemoryFormat.BINARY)
                .setBackupCount(0)
                .setAsyncBackupCount(2)
                .setEvictionConfig(new EvictionConfig()
                        .setEvictionPolicy(EvictionPolicy.LFU)
                        .setMaxSizePolicy(MaxSizePolicy.ENTRY_COUNT)
                        .setSize(200000)
                )
                .setExpiryPolicyFactoryConfig(
                        new CacheSimpleConfig.ExpiryPolicyFactoryConfig(
                                new CacheSimpleConfig.ExpiryPolicyFactoryConfig.TimedExpiryPolicyFactoryConfig(
                                        CacheSimpleConfig.ExpiryPolicyFactoryConfig.TimedExpiryPolicyFactoryConfig.ExpiryPolicyType.ACCESSED, new CacheSimpleConfig.ExpiryPolicyFactoryConfig.DurationConfig(15L, TimeUnit.MINUTES)
                                )
                        )
                )));
    }

    private void setLockConfig() {
        final CPSubsystemConfig cpSubsystemConfig = config.getCPSubsystemConfig();

        cpSubsystemConfig.setLockConfigs(ImmutableMap.of("*", new FencedLockConfig()
                        .disableReentrancy()
                )
        );
    }

    private void setConfigPatternMatcherConfig() {
        config.setConfigPatternMatcher(new WildcardConfigPatternMatcher());
    }

    public Config toConfig() {
        setPropertyConfig();
        setInstanceNameConfig();
        setClusterNameConfig();
        setJoinConfig();
        setPartitionGroupConfig();
        setCacheConfig();
        setLockConfig();
        setConfigPatternMatcherConfig();

        return config;
    }

    private boolean isAws() {
        final Set<String> activeProfiles = Arrays.stream(environment.getActiveProfiles()).collect(Collectors.toSet());
        return activeProfiles.stream().anyMatch(AWS_PROFILES::contains);
    }
}
@blazember
Copy link
Contributor

Thank you for the report @pkgonan!

Could you please share your heap and GC settings as well if anything specified?

I see metrics related objects in the report you attached, something introduced in 4.0. Could you please try disabling the metrics entirely and see if it makes the issue to disappear:

config.getMetricsConfig().setEnabled(false);

@blazember
Copy link
Contributor

Also, do you have GC logs or statistics? The unreachable objects means the GC can free them up on the next run, but I suppose it runs infrequently so some garbage can pile up in the heap. Judging based on the memory chart and assuming the scarps on it are anyhow related to the GC activity, it runs approximately once an hour, while metrics are collected every 5 seconds. So if that's the case, metrics related garbage is expected. It's not clear if the memory chart shows the machine's memory or the JVM's heap, I guess it's the former. Having that said, if the issue disappears after the metrics collection got disabled with the above config, it means only the pattern you see is caused by that, but it's not necessarily a leak. Could you please also enable and send the GC logs? That should tell more. You can enable the GC log by adding the following to the JVM arguments: -XX:+PrintGCDetails -XX:+PrintGCDateStamps -Xloggc:$path_of_log_file

@pkgonan
Copy link
Author

pkgonan commented Feb 20, 2020

@blazember Thank you for your reply.
Hazelcast 4.0 memory didn't increase anymore after ignoring metric setting.

config.getMetricsConfig().setEnabled(false);

[Hazelcast 4.0 With Ignore Metric Memory Pattern]
Hazelcast 4 0 With Disabled Metric Memory Pattern

[My G1 GC setting]

-server -Xms1g -Xmx1g -XX:+UseG1GC -XX:NewRatio=2 -XX:+PrintGCDetails -XX:+PrintGCDateStamps -verbose:gc -Xloggc:/var/log/gc.log -XX:+HeapDumpOnOutOfMemoryError -XX:HeapDumpPath=/var/log -Djava.net.preferIPv4Stack=true

But, i can not understand why this situation is not memory leak.

Having that said, if the issue disappears after the metrics collection got disabled with the above config, it means only the pattern you see is caused by that, but it's not necessarily a leak.

I will append gc logs that you requested.

@mmedenjak mmedenjak added Team: Core Source: Community PR or issue was opened by a community user and removed Type: Defect labels Feb 20, 2020
@blazember
Copy link
Contributor

blazember commented Feb 20, 2020

@pkgonan great, we identified the main cause. I still see a very minimal increase though in the last screenshot as well, but it can be caused by anything.

But, i can not understand why this situation is not memory leak.

In the JVM heap a memory leak occurs if references to objects no longer in use are retained, preventing these objects from freed up by the GC. In the end, the GC will struggle with freeing up memory for new allocations and OutOfMemoryErrors will be thrown. On JVM heap charts this looks like the bottom of the scarps are getting higher with every GC execution. Your chart and heap dump doesn't prove this though. The report says 95% of your heap dump contains unreachable objects that the GC should free up in the next run. It just seems to run infrequently, which makes sense since the cluster is not under load. This can show as a slightly increasing memory usage while the application is warming up that may take long if the application doesn't do anything.

Besides the GC log, another idea is that you can capture the output of the following periodically, let's say once an hour:

jcmd $PID PerfCounter.print | grep gc
jcmd $PID GC.class_stats | head -n20

It doesn't require an application restart. The first shows low-level GC related JVM metrics such as GC invocation count and memory pool metrics. The second shows the top of the class histogram of the reachable objects. After a few samples, it should give an idea of what's going on. Note that this jcmd command is Oracle/OpenJDK specific.

I will try to reproduce this with the JVM arguments you provided. Will get back to you with my findings.

@blazember blazember self-assigned this Feb 20, 2020
@pkgonan
Copy link
Author

pkgonan commented Feb 21, 2020

@blazember
Here is gc.log file !
Please check it out.

Thank you

gc.log

@blazember
Copy link
Contributor

Thank you @pkgonan!
I assume this GC log is with metrics enabled.

This GC log shows no symptoms of leaking. You can analyze it with https://gceasy.io/ if you wish and check the Young Gen under the Interactive Graphs section. It shows that after each GC execution the used (young) heap memory is more or less the same. This is how it should look like if there is no leak, especially in an idle application.

My local test showed the same results. I ran two HZ members on the same machine, one with metrics disabled and the other with metrics enabled. I used the configuration and JVM arguments you provided, with the only exception of making metrics collection more frequent (1s instead of the default5s) to show results earlier. Both allocate memory, but the member with metrics enabled allocates more, as expected.

image

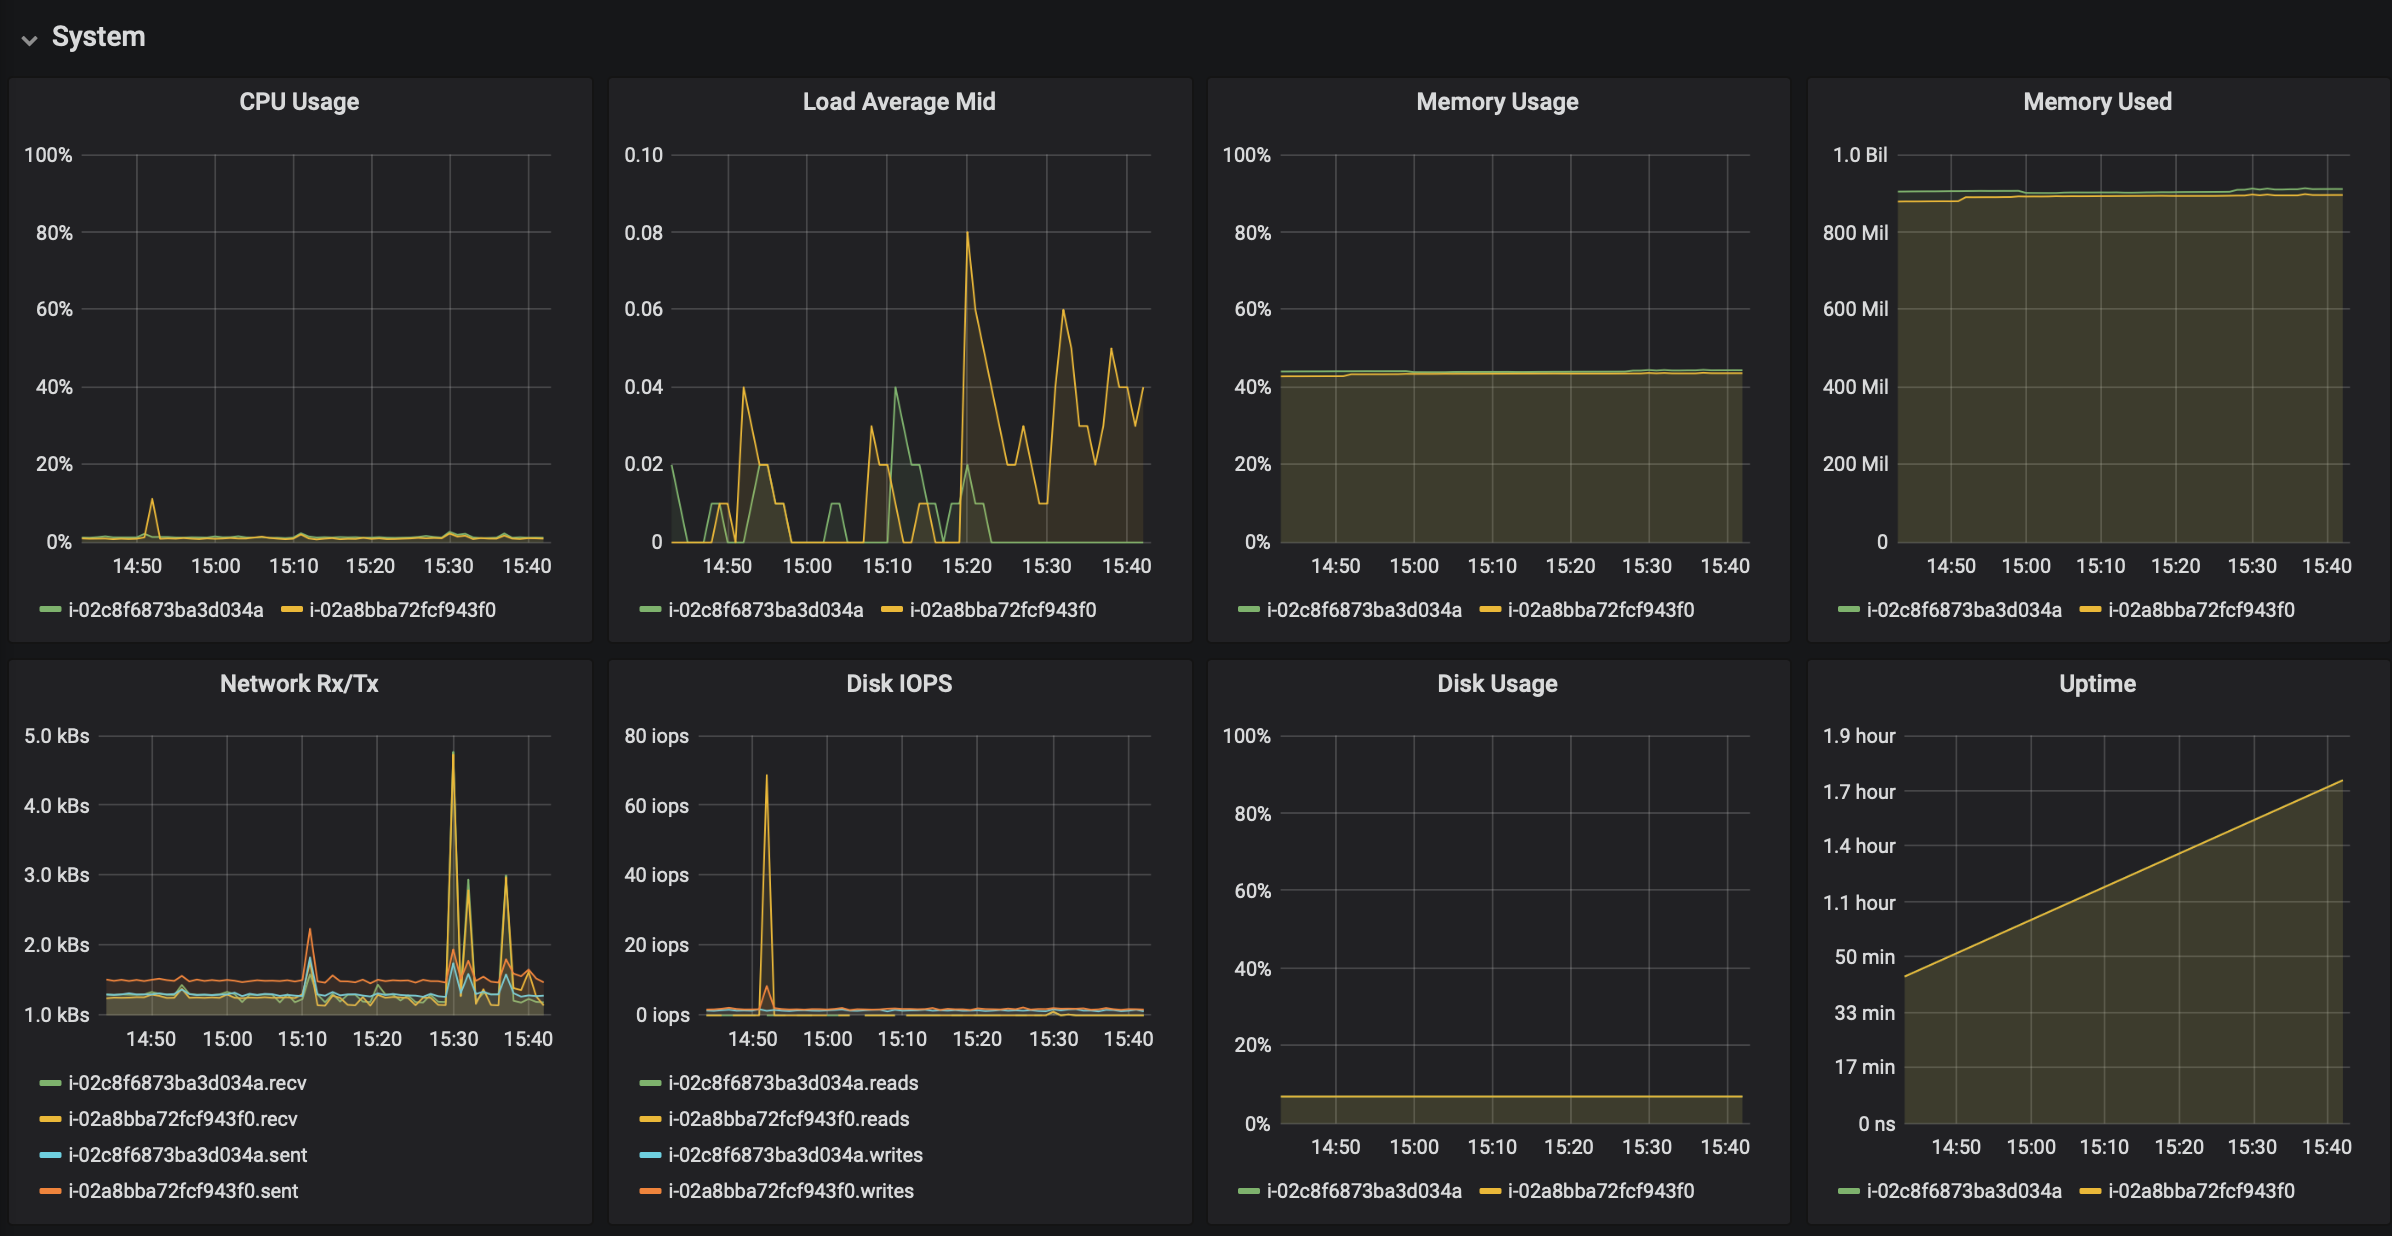
Also, see how the machine memory chart looked at the same time:

image

It started with a flat chart and after the JVMs hosting the HZ members started the used memory started increasing, despite that the JVM heap charts looked healthy in the meantime. This is because the JVM needs to warm up, which amongst other things comes with allocating, resizing its internal memory pools. The warmup time depends on the hosted application and I believe this is what you see if you compare the two charts with metrics enabled and disabled. Therefore, it is advisable to monitor the JVM heap besides monitoring the machine memory. For this, one option is Jolokia: https://jolokia.org/. Telegraf, for example, has a Jolokia input plugin: https://docs.influxdata.com/telegraf/v1.13/plugins/plugin-list/#jolokia2_agent, also there is a ready-to-use Grafana Jolokia dashboard: https://grafana.com/grafana/dashboards/8991. Note that Jolokia is a Java agent bridging JMX to HTTP, therefore it comes with some additional allocation.

I think we clarified that what you see is not a leak. Please let me know if you have further questions or if we can close the issue as explained.

@pkgonan
Copy link
Author

pkgonan commented Feb 24, 2020

@blazember
Thank you for your feedback.

I will check heap memory usage not physical memory.!

@pkgonan pkgonan closed this as completed Feb 24, 2020
@cksiow
Copy link

cksiow commented Aug 5, 2020

just some update info
currently we are using 4.0.2, and before disable the metric the memory can shot up to 1GB in a day without any usage
after disable, it took 40mb in a day even got some usage.
probably the metric feature making memory leak.

@mmedenjak
Copy link
Contributor

@cksiow you might want to switch to Hazelcast 4.0.3 once it's released where we made some improvements to how metrics uses JVM memory (#17145).

@mmedenjak mmedenjak added this to the 4.0.3 milestone Sep 17, 2020
Sign up for free to join this conversation on GitHub. Already have an account? Sign in to comment
Labels
Source: Community PR or issue was opened by a community user Team: Core
Projects
None yet
Development

No branches or pull requests

4 participants