Skip to content
New issue

Have a question about this project? Sign up for a free GitHub account to open an issue and contact its maintainers and the community.

By clicking “Sign up for GitHub”, you agree to our terms of service and privacy statement. We’ll occasionally send you account related emails.

Already on GitHub? Sign in to your account

Grafana 9.1.4 NoData reduce problem #55085

Closed
matrog opened this issue Sep 13, 2022 · 16 comments · Fixed by #55347, #56812 or #56816
Closed

Grafana 9.1.4 NoData reduce problem #55085

matrog opened this issue Sep 13, 2022 · 16 comments · Fixed by #55347, #56812 or #56816
Assignees
Labels
area/alerting Grafana Alerting
Milestone

Comments

@matrog
Copy link

matrog commented Sep 13, 2022

After upgrading from grafana 8.5.6 to 9.1.4 i'm getting the following error message if the query returns "NoData", which is a totally expected situation in case we do not receive any data from one of our probes.

3

This alert used to work fine in v8.5.6 producing a NoData Alert.

Here's the alert config

1

then a reduce and a math expression

2

Log Snippet

logger=ngalert uid=CwG7uaM4k org=1 version=1 attempt=0 now=2022-09-13T12:22:00Z t=2022-09-13T12:22:06.93425422Z level=error msg="failed
 to evaluate alert rule" results="[{Instance: State:Error Error:failed to execute conditions: can only reduce type series, got type noD
ata EvaluatedAt:2022-09-13 12:22:00 +0000 UTC EvaluationDuration:6.934249393s EvaluationString: Values:map[]}]" duration=25.161092ms
logger=ngalert t=2022-09-13T12:22:06.934335965Z level=debug msg="state manager processing evaluation results" uid=CwG7uaM4k resultCount
=1

The expected result is NoData state if the query returns NoData

Environment:

  • Grafana version: 9.1.4
  • Data source type & version: Flux (with Influxdb 2.1.0)
  • OS Grafana is installed on: RedHat 8.6
  • User OS & Browser: Chrome / Firefox on macOS
  • Grafana plugins: N/A
  • Others: N/A
@JohnnyQQQQ JohnnyQQQQ added area/alerting Grafana Alerting type/bug needs investigation for unconfirmed bugs. use type/bug for confirmed bugs, even if they "need" more investigating and removed type/bug labels Sep 13, 2022
@majkinetor
Copy link

I have the same problem after upgrade.

Even if I set:

image

I get OK annotations, so it transitions from OK to OK which is certainly a bug.

I will have to disable all alerts until this is resolved since OK/NoData/Errrors spam like there is no tomorrow so meaningfull alerts are lost in the noise.

@jl-678
Copy link

jl-678 commented Sep 16, 2022

I see this same problem too and posted about it including a screenshot in the Grafana Forum.

@grobinson-grafana
Copy link
Contributor

Hi! 👋

This is an issue with how Grafana reduces data frames from InfluxDB. With InfluxDB, no data returns a mathexp.NoData data frame, where as with Prometheus no data returns no data frames. Grafana thinks there is data and attempts to reduce the mathexpr.NoData data frame, but mathexpr.NoData cannot be reduced and so Grafana returns the error can only reduce type series, got type noData.

@jl-678
Copy link

jl-678 commented Sep 17, 2022

Thank you for the explanation. Am I correct in interpreting your answer to say that this is indeed a bug in how Grafana treats no data from Influx?

@grobinson-grafana grobinson-grafana self-assigned this Sep 17, 2022
@grobinson-grafana grobinson-grafana removed the needs investigation for unconfirmed bugs. use type/bug for confirmed bugs, even if they "need" more investigating label Sep 17, 2022
@grobinson-grafana
Copy link
Contributor

Hi! I have opened a pull request to fix this #55347. It should be available in Grafana 9.1.6.

@grobinson-grafana
Copy link
Contributor

Hi! I don't think #55347 will be merged in time for 9.1.6, so it will instead be available in Grafana 9.1.7.

@vinivosh
Copy link

vinivosh commented Oct 6, 2022

I don't understand how #55347 fixed this, actually. I'm on v9.2.0-beta.1 right now and the can only reduce type series, got type noData error is still spat out when an InfluxDB query of mine returns nothing at all. This happens both in a "Reduce" condition or in the "Classic Condition".

Grafana then just sends a DatasourceError notification, instead of dealing with a NoData situation correctly. This didn't happen in Grafana 7.

Specially annoying when you have other queries in the same alert. They won't be run even if they'd return something, just because one other query returned nothing.

Am I missing something here?

@matrog
Copy link
Author

matrog commented Oct 6, 2022

i just installed 9.1.7 and I can confirm the issue is solved, now the NoData is handled in proper way

@grobinson-grafana
Copy link
Contributor

Hi @vinivosh! 👋 Would it be possible to see the SQL query and the database schema of the table you are querying in your alert rule?

@vinivosh
Copy link

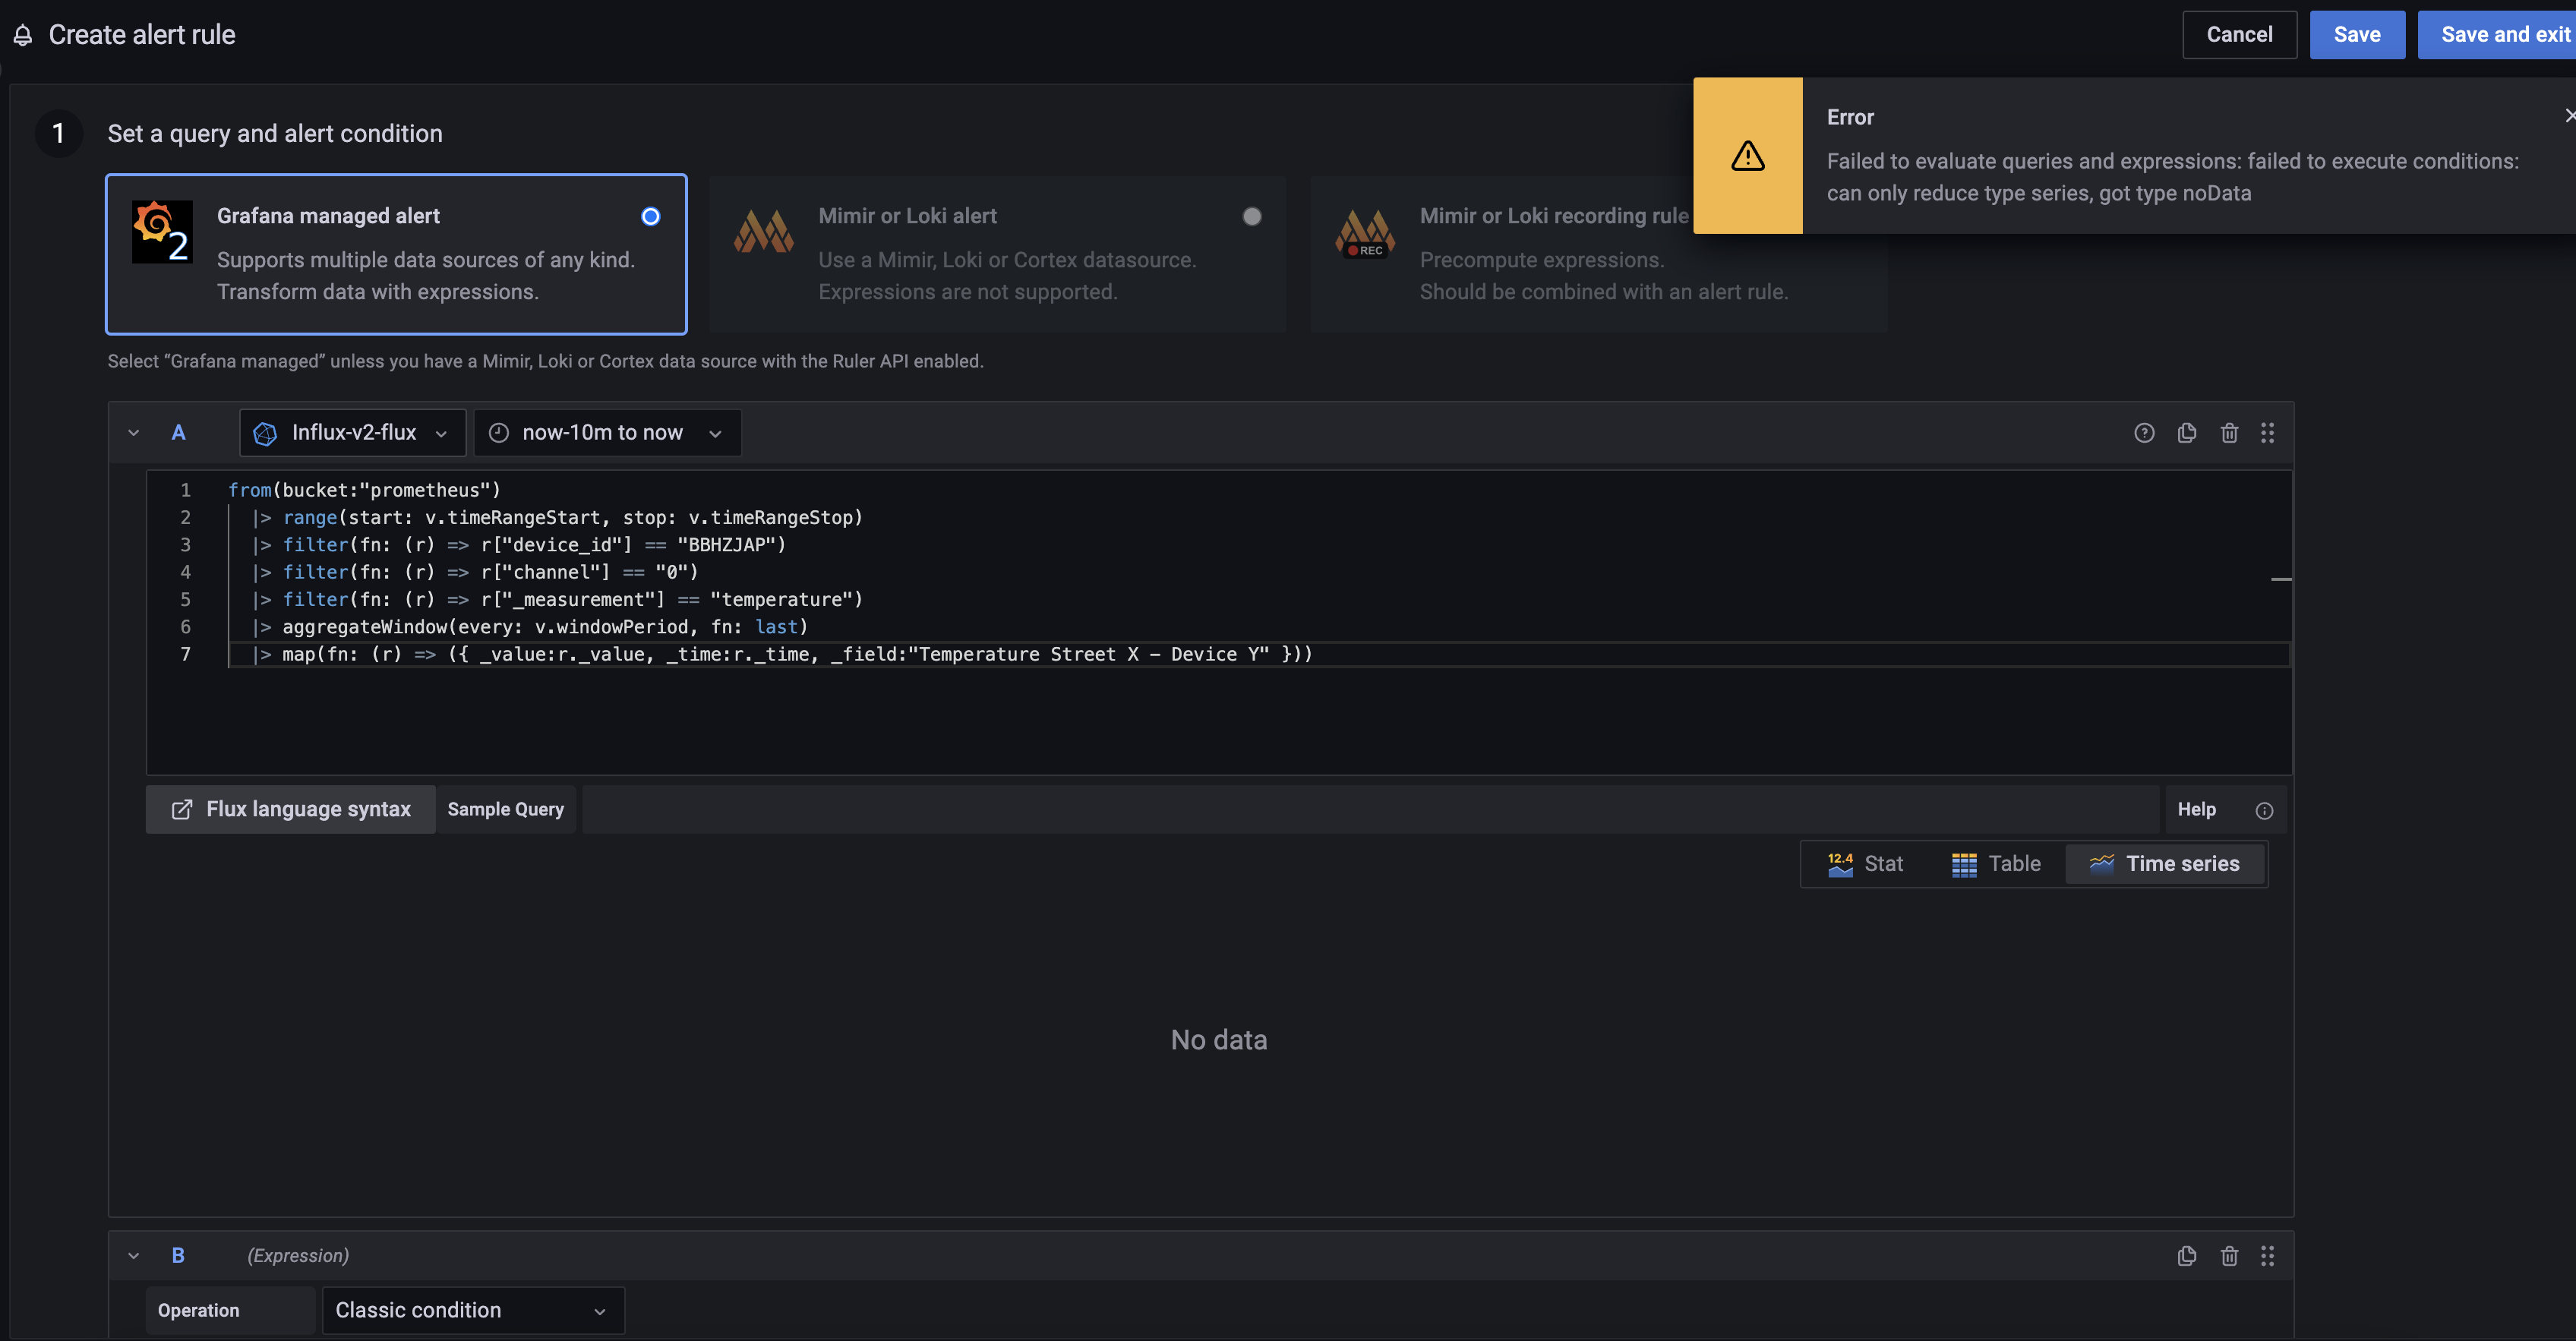
I'm actually using Influx' own Flux query language to query data from InfluxDB v2.3.0.

The query in question:

from(bucketID: v.defaultBucket)
  |> range(start: v.timeRangeStart, stop: v.timeRangeStop)
  |> filter(fn: (r) => r["device_id"] == "BBHZJAP")
  |> filter(fn: (r) => r["channel"] == "0")
  |> filter(fn: (r) => r["_measurement"] == "temperature")
  |> aggregateWindow(every: v.windowPeriod, fn: last)
  |> map(fn: (r) => ({ _value:r._value, _time:r._time, _field:"Temperature Street X - Device Y" }))

It currently returns nothing, because the hardware isn't set up properly at the moment. I still wanted other queries in the alert to be ran, though, as they do return data. Or at least for Grafana to deal with this scenario normally, by sending a NoData alert.

The conditions on the alert:
image

I also tried using Math or Reduce conditions, but the same DatasourceError happens.

@grobinson-grafana
Copy link
Contributor

Hi @vinivosh! I'm not sure I can reproduce the issue. I copied the FluxQL and created an alert with Reduce, and I get a DatasourceNoData alert. I can reproduce it with Classic Condition but that's because we haven't applied the same fix to classic conditions (should have a fix up this week).

@matrog
Copy link
Author

matrog commented Oct 11, 2022

I did some tests and i'm getting same error as @vinivosh , I was not able to experience that before because I don't use classic condition but always the reduce.

Screenshot 2022-10-11 at 14 50 22

with the same query i'm stil getting the error

@grobinson-grafana
Copy link
Contributor

Hi @matrog! In the screenshot you are using a Classic Condition which hasn't been fixed. It's just Reduce expressions that have been fixed, but @vinivosh mentioned he is still getting the error in Reduce expressions.

@matrog
Copy link
Author

matrog commented Oct 11, 2022

@grobinson-grafana is there an issue to track the status of the classic condition + NoData?

@grobinson-grafana
Copy link
Contributor

Hi @matrog! I've just merged a fix for NoData in Classic Conditions which should be available in both 9.1.9 and 9.2.1.

@matrog
Copy link
Author

matrog commented Oct 12, 2022

Super! thanks

Sign up for free to join this conversation on GitHub. Already have an account? Sign in to comment