Know when slow and frozen frames occurred during a transaction #1912
Comments
|
We decided to create spans when a slow or frozen frame occurs. |
|
Wait for #1910 to get merged before tackling this PR because it tracks the timestamps of slow and frozen frames. |
|
FrameTimestamps are stored here Tracer adds them to the profile here sentry-cocoa/Sources/Sentry/SentryTracer.m Lines 439 to 441 in 62ea014 |
|
@philipphofmann You explained the thinking behind this last week but now that I am looking into this, I am not sure how you wanted this to work.
Can we go over this together? Thanks! |
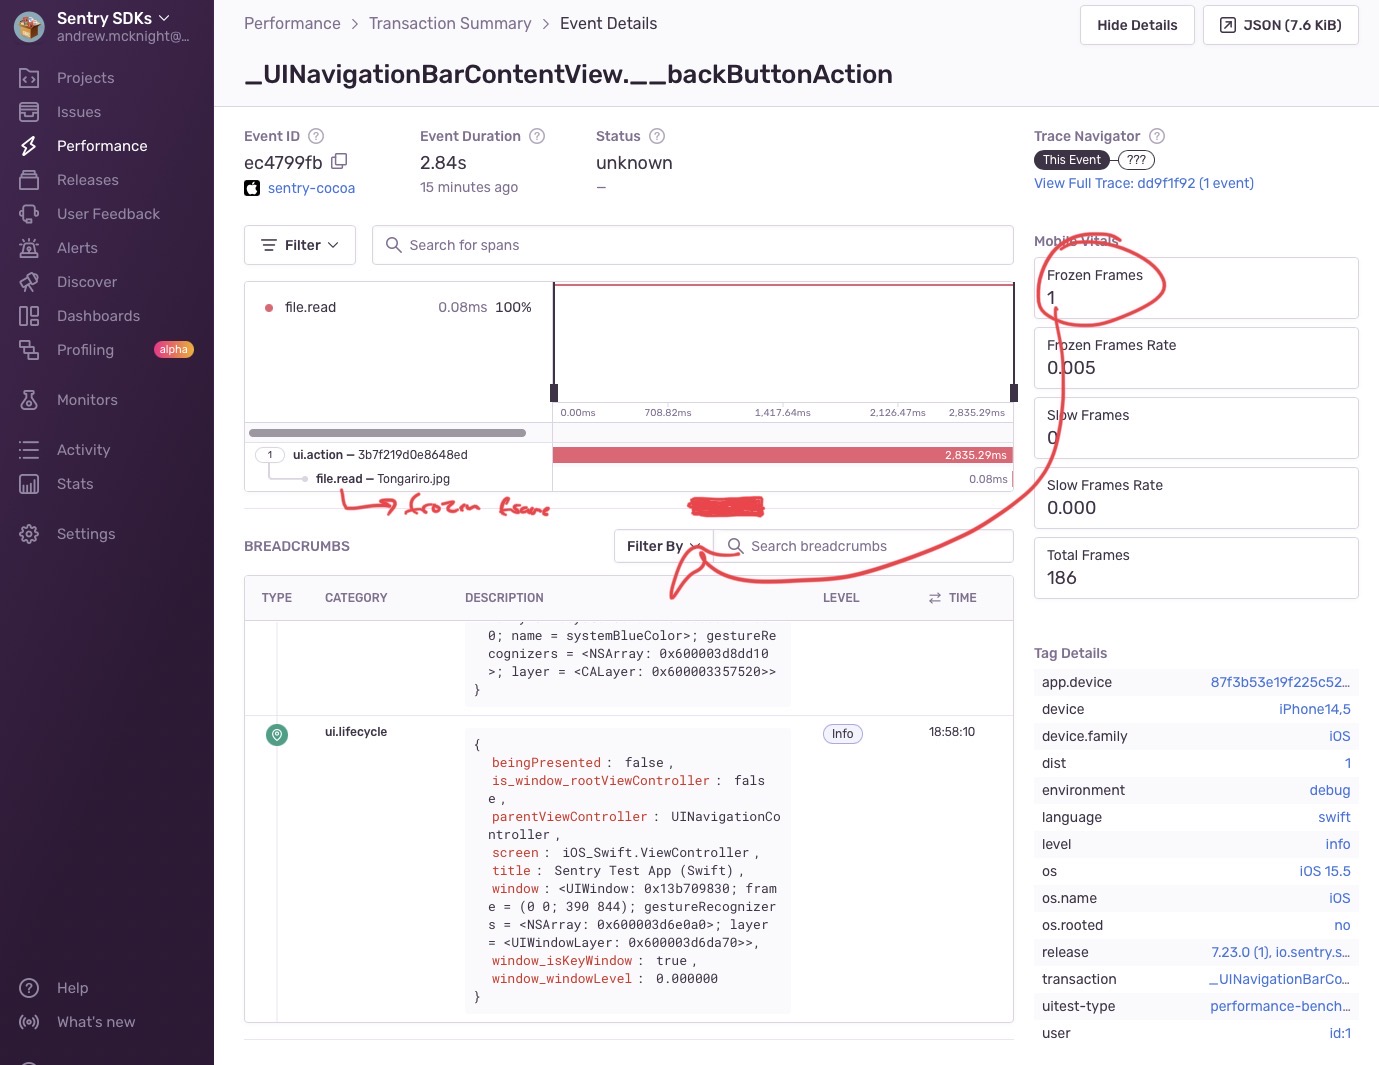
We talked about this in profiling but decided at the time we could compute this server-side, since we also send the expected framerates (as a time series since it can change on modern devices). But it would be easy to track them in separate arrays from each of these callsites: here and here. And just so I understand what's ultimately being requested, I imagine we'd want to display something like this?
|
|
Check my PR where I had a working implementation using those callsites: #2028. But ultimately it doesn't result in a very useful thing in the Sentry UI, see comments in that PR as well. |
|
We're closing this based on the result of #2028. |
|
Reopened because of #2028 (comment) |
|
After investigating this feature, it turned out that it is not that useful. If a lifecycle method needs 200 ms to complete, and we put a slow frame span below it, it doesn't add extra value because you can assume that already if you see that you have one slow frame. By just looking at the raw numbers of slow and frozen frames, you know that you have to fix something, and you should keep an eye on the spans that took the longest time. |
Description
Currently, the SDK attaches slow and frozen frames to transactions. The problem is that the users don't know when these slow and frozen occurred during the transaction. We could attach the slow and frozen frames to individual spans or we could add timing information as proposed in #1910, but then Sentry would need to do some work to add this somehow to the transactions. We could even add spans for slow and frozen frames.
Maybe only add to UI spans, because there could be two spans running at the same time. Furthermore, slow and frozen frames might not really make sense for file IO, DB, or network spans.
The text was updated successfully, but these errors were encountered: