Name
BankNifty超级趋势交易策略BankNifty-Supertrend-Trading-Strategy
Author
ChaoZhang
Strategy Description
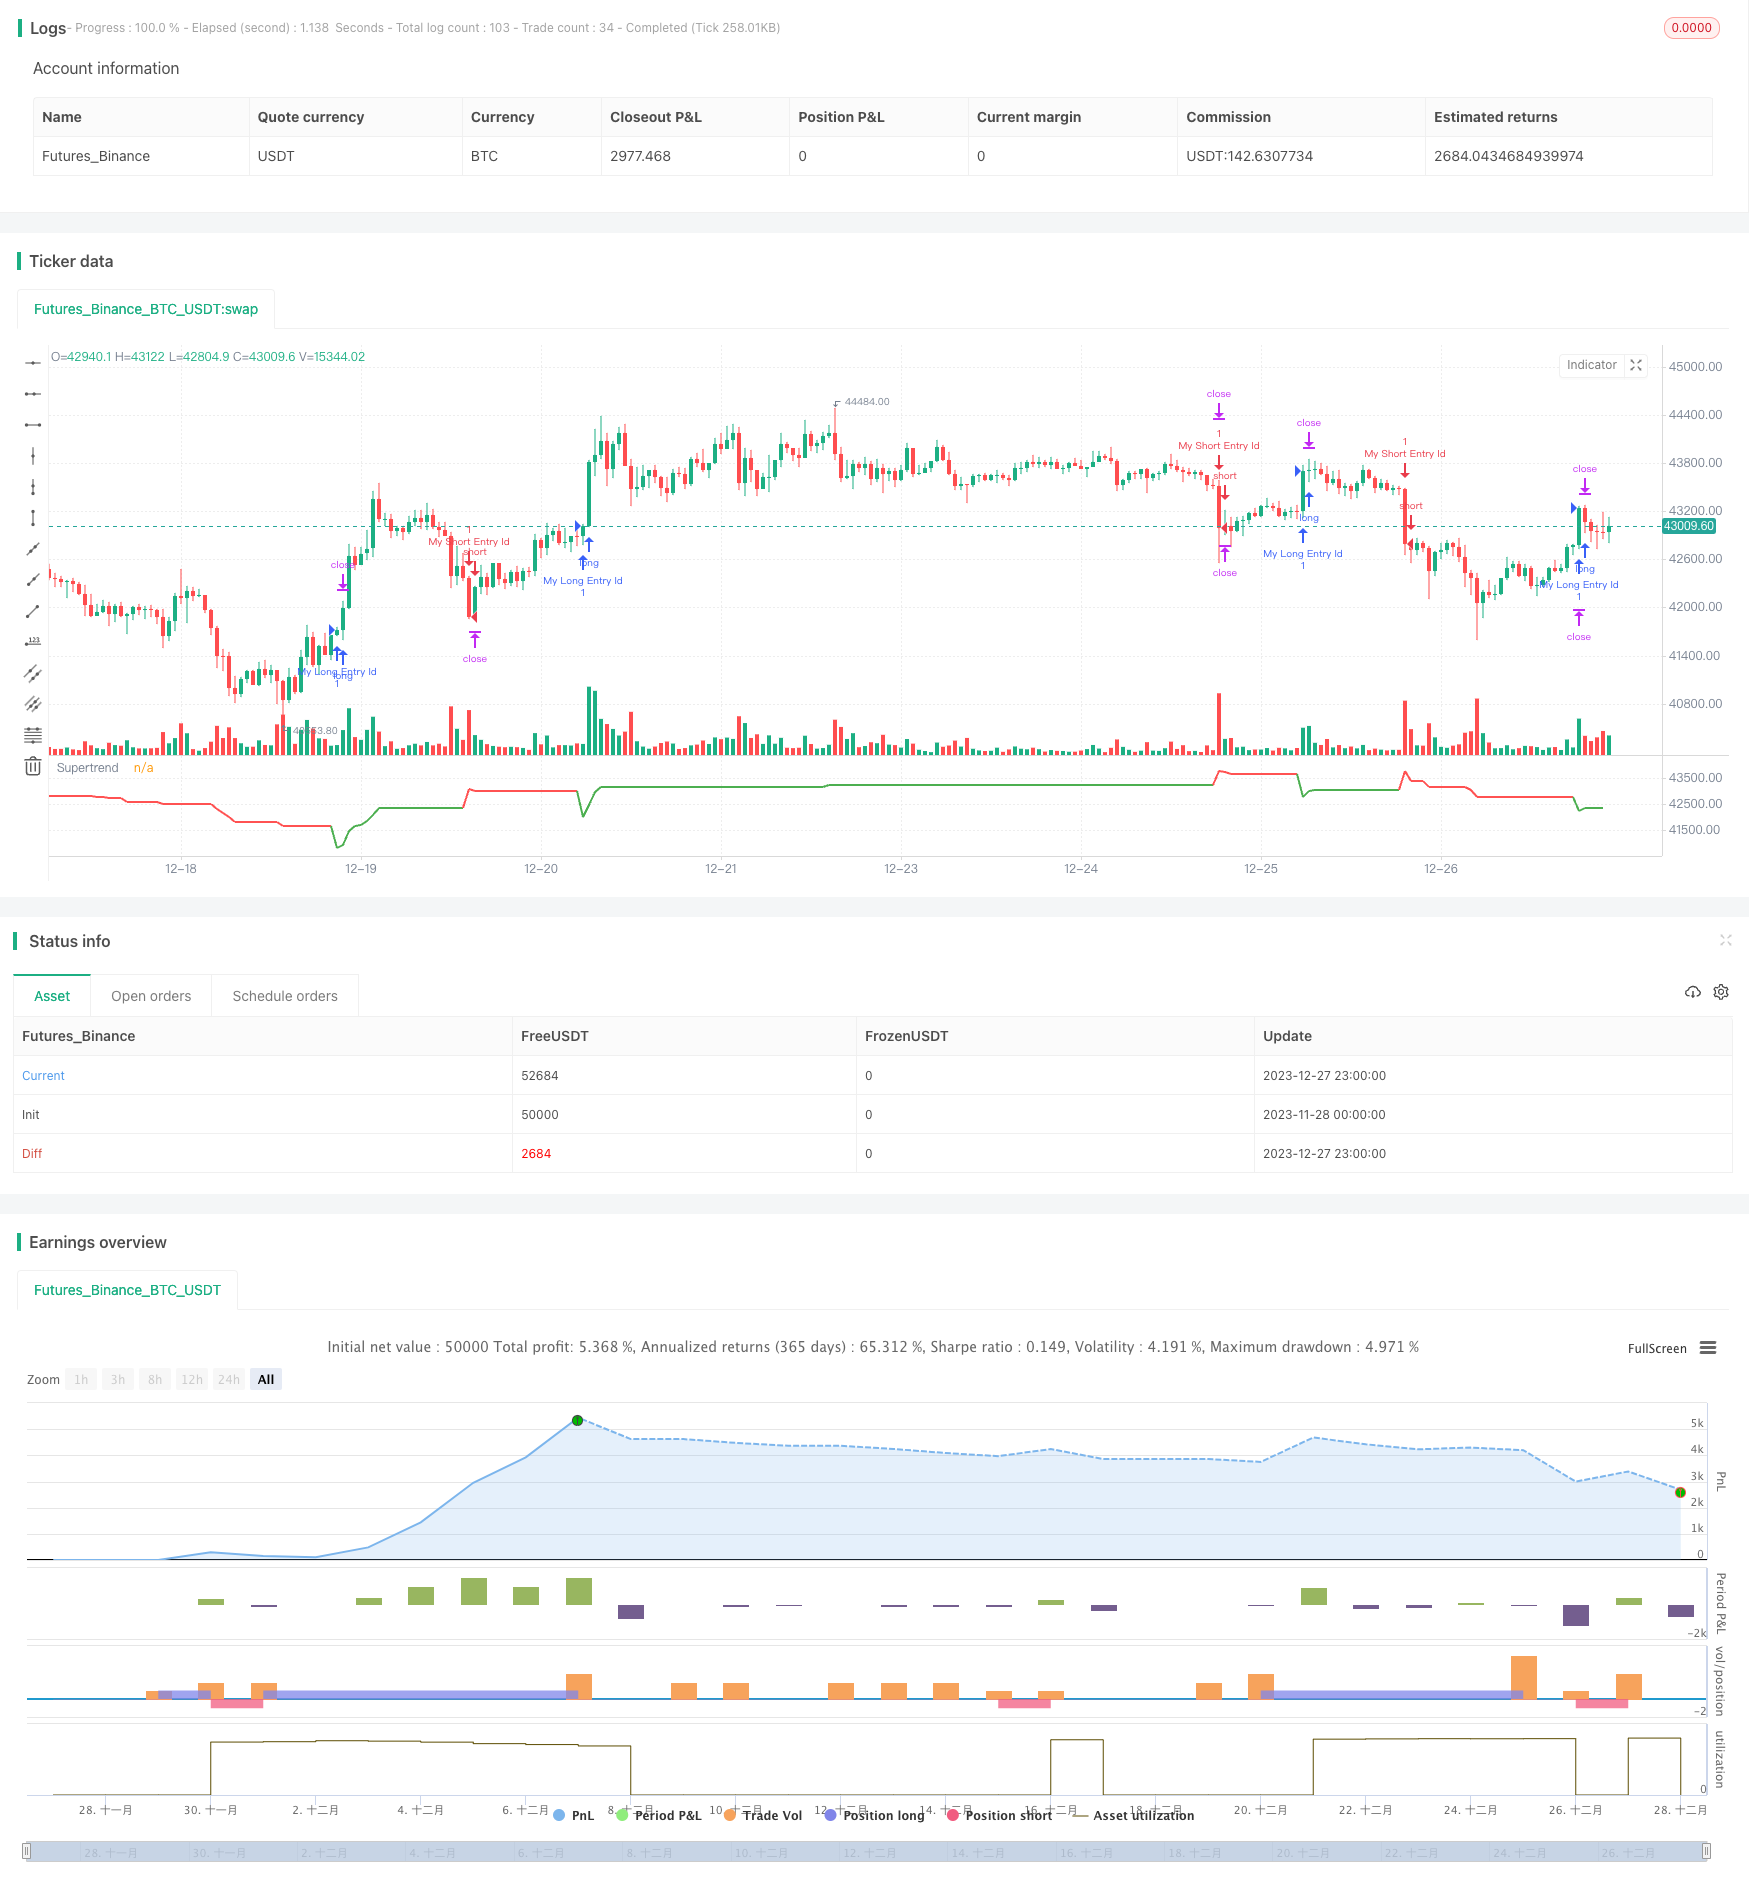
这是一个基于BankNifty 5分钟K线的超级趋势指标交易策略。该策略主要利用超级趋势指标识别趋势,结合交易时段和风险管理规则进行交易。
该策略首先定义了交易时段和日期范围等输入变量。交易时段设置为印度交易时段,从上午9:15到下午3:10。
然后计算超级趋势指标及其方向。超级趋势指标可以识别趋势的方向。
在每个交易时段开始时,策略要等待3根K线形成,然后才会考虑进场。这是为了过滤假突破。
多头信号是超级趋势指标方向变化由下向上时;空头信号是超级趋势指标方向变化由上向下时。
进场后会设置止损,固定止损点数和追踪止损百分比都可以通过输入变量调整。
在交易时段结束时,策略会平掉所有未平仓的头寸。
这是一个利用指标识别趋势的简单交易策略。它具有如下优势:
- 利用超级趋势指标判断趋势方向,可以有效识别趋势
- 结合交易时段,可以避开市场最剧烈波动的开盘和收盘时段
- 设置追踪止损,可以锁定利润
- 可以通过输入变量自由调整的参数较多,适应性强
该策略也存在一些风险:
- 超级趋势指标存在滞后,可能错过最佳进场时机
- 单一指标判断容易受假突破影响,胜率可能不高
- 没有考虑大盘趋势,可能与大盘产生背离
- 止损点数设定不当可能造成超出预期的损失
可以通过优化超级趋势指标的参数或增加其他指标判断来减少这些风险。
该策略还可以从以下几个方面进行优化:
- 增加其他指标判断,形成组合交易策略,可以提高策略稳定性
- 添加对大盘走势的判断,避免与大盘产生背离
- 优化超级趋势指标的参数,找到最适合的长度和因子
- 调整止损策略,例如随着趋势走势逐步调整止损点
- 测试不同的交易品种,寻找最匹配该策略的品种
本策略是一个基于BankNifty 5分钟线的超级趋势指标交易策略。它利用超级趋势指标判断趋势方向,结合交易时段和风险管理规则进行交易。相比复杂的量化策略,该策略规则简单清晰,容易理解和实施。作为一个示例策略,它为日后进行优化和改进提供了基础和方向。通过不断地完善和提高,希望该策略可以成为一个可靠稳定盈利的量化交易策略。
||
This is a trading strategy based on the 5-minute K-line of BankNifty using the Supertrend indicator. The strategy mainly utilizes the Supertrend indicator to identify trends and combines trading sessions and risk management rules to trade.
The strategy first defines input variables such as trading sessions and date ranges. The trading session is set to the Indian trading session from 9:15 am to 3:10 pm.
It then calculates the Supertrend indicator and its direction. The Supertrend indicator can identify the direction of the trend.
At the beginning of each trading session, the strategy waits for 3 candles to form before considering entering a trade. This is to filter false breakouts.
The long signal is when the Supertrend indicator direction changes from down to up; the short signal is when the Supertrend direction changes from up to down.
After entering, stop loss will be set. Both fixed stop loss points and trailing stop loss percentage can be adjusted through input variables.
At the end of the trading session, the strategy will close all open positions.
This is a simple trading strategy that uses indicators to identify trends. It has the following advantages:
- Use Supertrend indicator to judge trend direction, which can effectively identify trends
- Combining trading sessions can avoid the most volatile opening and closing session
- Set trailing stop loss to lock in profits
- Many parameters can be adjusted freely through input variables, high adaptability
The strategy also has some risks:
- Supertrend indicator has lagging, may miss the best entry point
- Single indicator judgment is prone to be affected by false breakouts, win rate may be low
- Does not consider market trend, may diverge from the overall market
- Improper stop loss setting may lead to larger than expected losses
These risks can be reduced by optimizing parameters of the Supertrend indicator or adding other indicator judgments.
The strategy can also be optimized in the following aspects:
- Add other indicator judgments to form a combined strategy, improve stability
- Add overall market trend judgment to avoid divergence from the market
- Optimize parameters of Supertrend indicator, find the best length and factor
- Adjust stop loss strategy, like trailing stop loss along with the trend
- Test on different products, find the best match
In summary, this is a Supertrend indicator trading strategy based on the BankNifty 5-minute chart. It utilizes the Supertrend indicator to determine the trend direction and combines trading sessions and risk management rules to trade. Compared to complex quantitative strategies, this strategy has simple and clear rules that are easy to understand and implement. As a sample strategy, it provides a foundation and direction for future optimization and improvement. Through continuous refinement and enhancement, it is hoped that the strategy can become a reliable and profitable quantitative trading strategy.
[/trans]
Strategy Arguments
| Argument | Default | Description |
|---|---|---|
| v_input_3 | timestamp(01 Dec 2023 23:59:59) | End Date |
| v_input_float_1 | 3 | Factor |
| v_input_1 | 0915-1510 | (?Indian Session Time)Session |
| v_input_2 | timestamp(01 Jan 2022 00:00:00) | (?Backtest Specific Range)Start Date |
| v_input_4 | 50 | (?SuperTrend Setting)ATR Length |
| v_input_5 | true | (?Delay at Session Start)Use Delay? |
| v_input_6 | 10 | Delay N numbers of candle |
| v_input_7 | true | (?Risk Management)Use Stoploss Points? |
| v_input_8 | 100 | Stop Loss Points |
| v_input_9 | true | Use Stoploss Trail? |
| v_input_float_2 | 0.1 | Stop Loss Trail% |
Source (PineScript)
/*backtest
start: 2023-11-28 00:00:00
end: 2023-12-28 00:00:00
period: 1h
basePeriod: 15m
exchanges: [{"eid":"Futures_Binance","currency":"BTC_USDT"}]
*/

//@version=5
strategy("BankNifty 5min Supertrend Based Strategy, 09:15 Entry with Date Range and Risk Management")

// Session and date range input variables
session = input("0915-1510", "Session", group="Indian Session Time")
start_date = input(title="Start Date", defval=timestamp("01 Jan 2022 00:00:00"), group="Backtest Specific Range")
end_date = input(title="End Date", defval=timestamp("01 Dec 2023 23:59:59"))
atrPeriod = input(50, "ATR Length", group="SuperTrend Setting")
factor = input.float(3.0, "Factor", step=0.1)

useDelay = input(true, "Use Delay?", group="Delay at Session Start")
Delay = useDelay ? input(10, title="Delay N numbers of candle", group="Delay at Session Start") : na

useDelay_stopLoss = input(true, "Use Stoploss Points?", group="Risk Management")
stopLoss = useDelay_stopLoss ? input(100, "Stop Loss Points", group="Risk Management"): na

useDelay_stopLossPerc1 = input(true, "Use Stoploss Trail?", group="Risk Management")
stopLossPerc1 =useDelay_stopLossPerc1 ? input.float(0.1, "Stop Loss Trail%", step=0.1,maxval = 1, group="Risk Management"): na
// Check if current time is within the specified session and date range
inSession = true

[supertrend, direction] = ta.supertrend(factor, atrPeriod)

// Wait for 3 candles to form at the start of every session
var candlesFormed = 0
if inSession and not inSession[1]
    candlesFormed := 1
else if inSession and candlesFormed > 0
    candlesFormed := candlesFormed + 1
else
    candlesFormed := 0


//

// Only enter trades if 3 candles have formed at the start of the session
entryce = (ta.change(direction) < 0) or (candlesFormed >= Delay and direction < 0)
exitce = ta.change(direction) > 0
entrype = (ta.change(direction) > 0) or (candlesFormed >= Delay and direction > 0)
exitpe = ta.change(direction) < 0
var entryPrice = 0.0
if entryce and inSession
    // Enter long trade
    onePercent = strategy.position_avg_price *stopLossPerc1
    entryPrice := close
    strategy.entry("My Long Entry Id", strategy.long, comment="long" )
    // Set stop loss at x% below entry price
    strategy.exit("My Long Exit Id", "My Long Entry Id", stop=(entryPrice - stopLoss),trail_points=onePercent )

if entrype and inSession
    onePercent1 = strategy.position_avg_price *stopLossPerc1
    entryPrice := close
    // Enter short trade
    strategy.entry("My Short Entry Id", strategy.short, comment="short")
    // Set stop loss at x% above entry price
    strategy.exit("My Short Exit Id", "My Short Entry Id", stop=(entryPrice + stopLoss),trail_points=onePercent1)

// Close all trades at end of session
if not inSession and strategy.opentrades > 0
    strategy.close_all()

// Plot Supertrend with changing colors
plot(supertrend, title="Supertrend", color=direction == 1 ? color.red : color.green, linewidth=2)
Detail
https://www.fmz.com/strategy/437044
Last Modified
2023-12-29 17:09:57