Name
BRAHMASTRA
Author
ChaoZhang
Strategy Description
⬜ Process ▶ Scan pivots which are in trend. This means, series of pivot Highs or pivot lows either in ascending order or descending order. ▶ Draw trend line between each of the pivots in the trend series. For example, if there are 5 pivot high uptrend pivots , draw mXn lines between each of these points. ▶ Select the trend line which is more accurate or stronger. Accuracy is measured by number of candles/wicks touching the line and number of candles which fall outside the line. Stronger trendlines will touch more candles and pivots with less overflow. ▶ Remove all lines except the most accurate one for each direction.
At any point of time, you will see upto 4 trend lines in this script.
▶ Trendline joining pivot highs in uptrending condition ▶ Trendline joining pivot lows in uptrending condition ▶ Trendline joining pivot highs in downtrending condition ▶ Trendline joining pivot lows in downtrending conditions
The older line will remain until the new one comes through of same type. Hence, you will still be able to see uptrending high and low trend lines for downtrending instruments which are created way back!! Also, new trendlines replace old ones only if they are more stronger (connect to more pivots with less overflow)
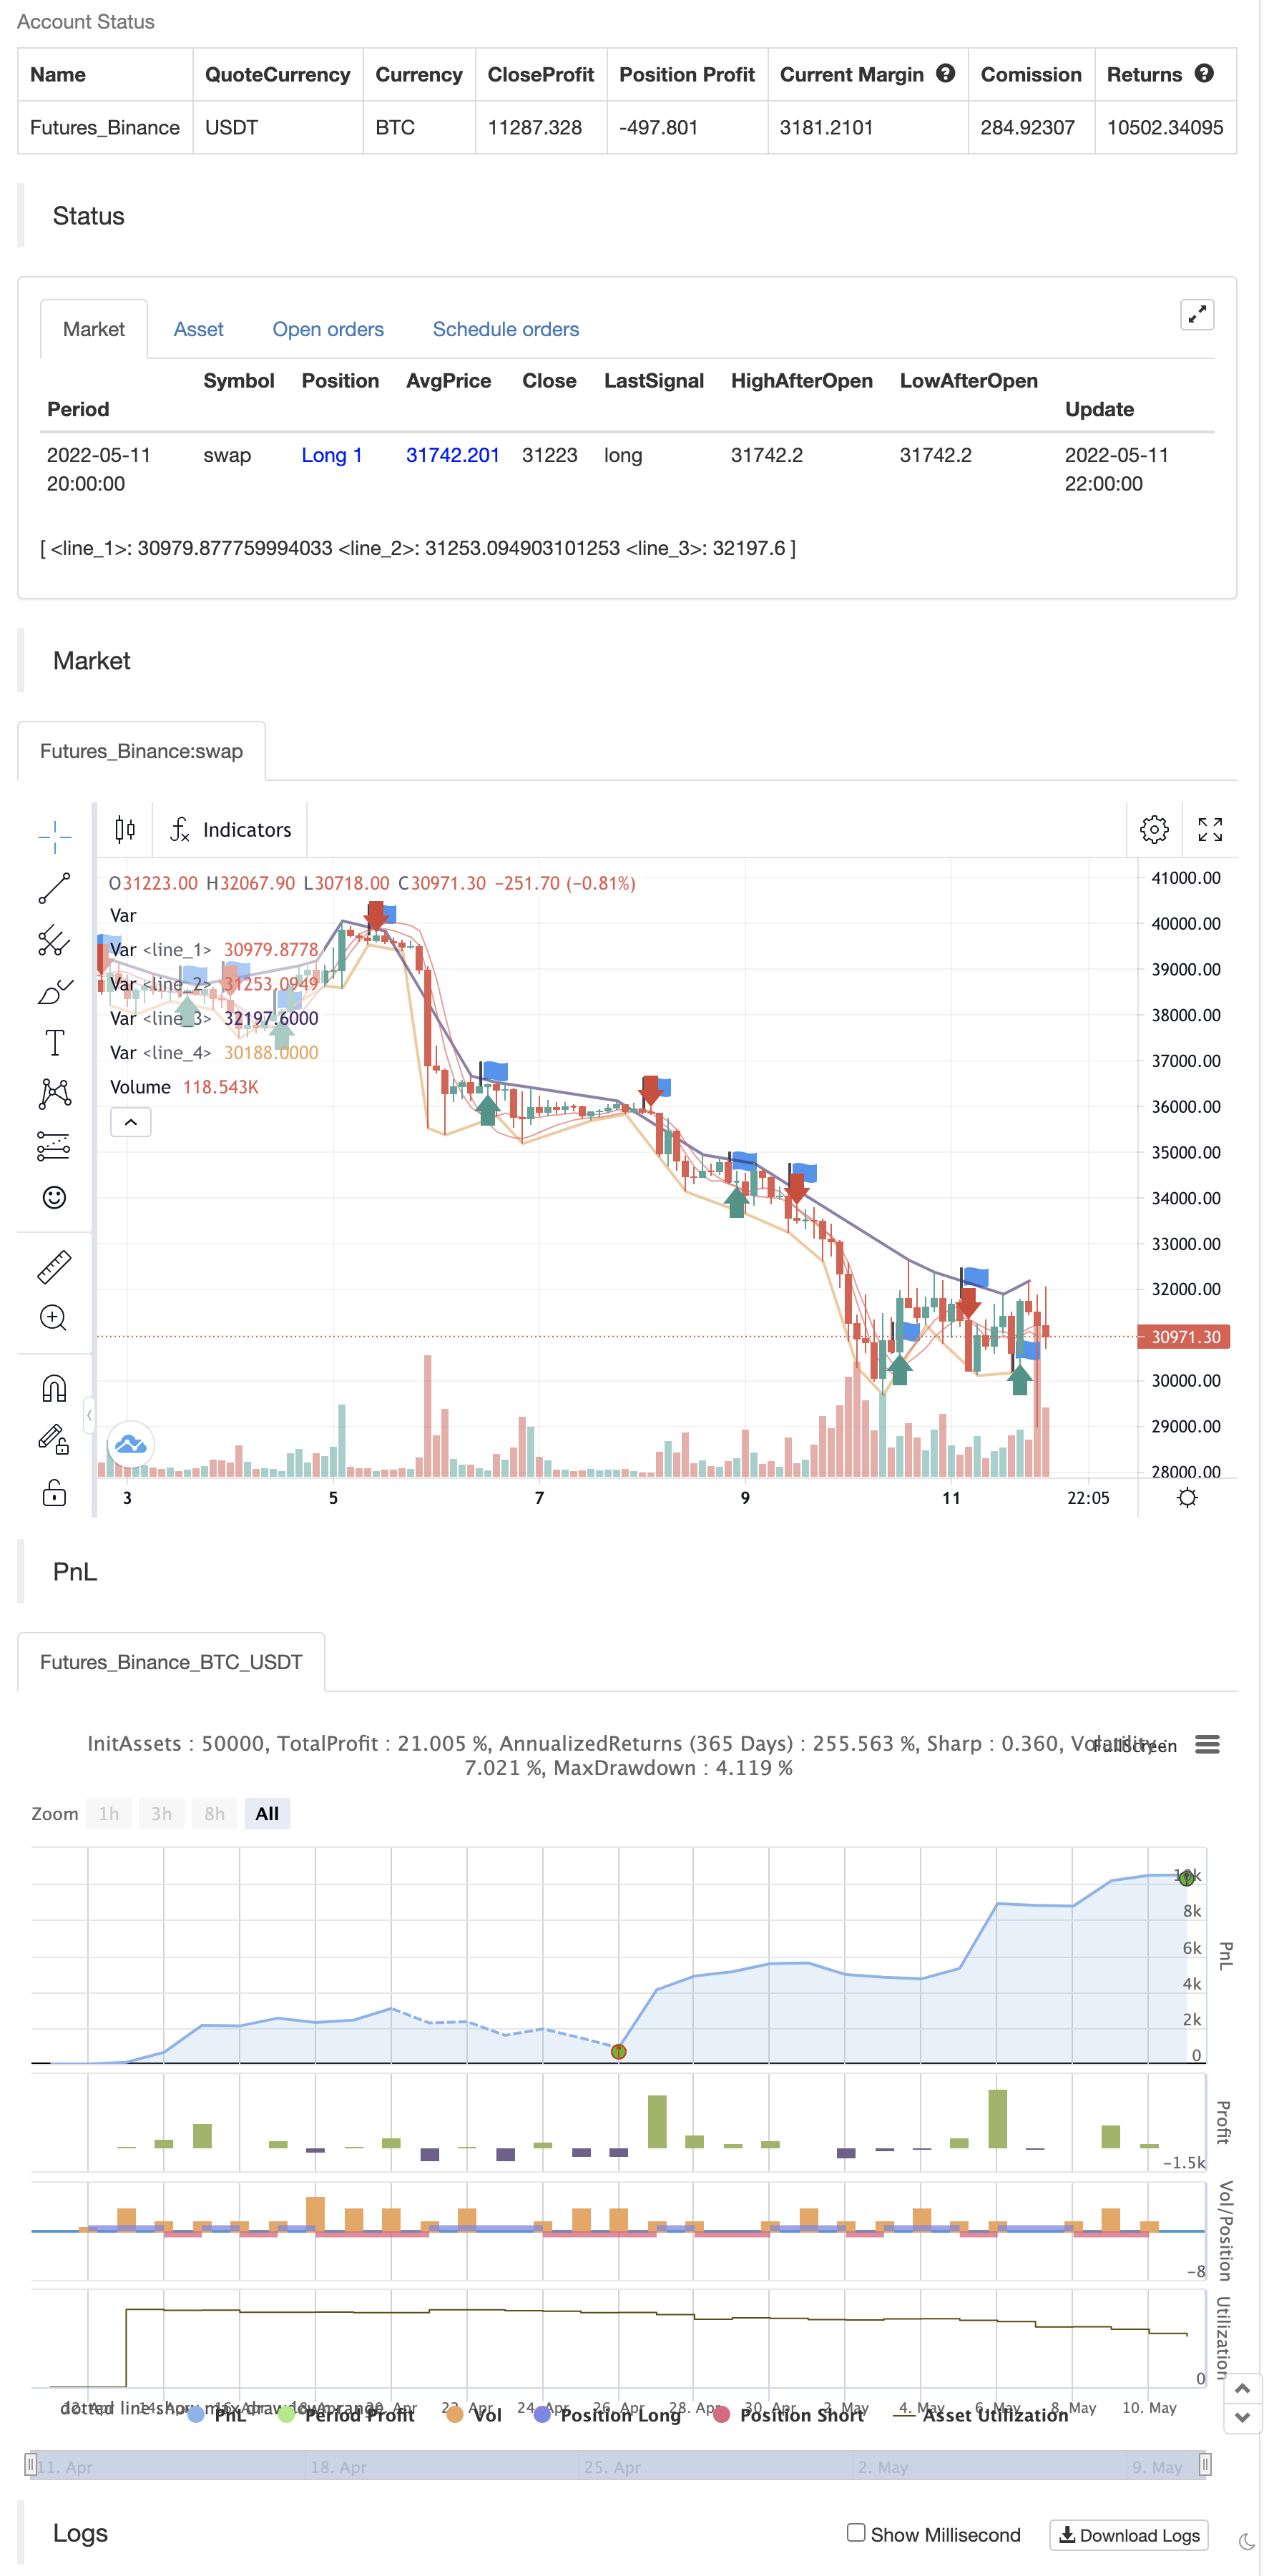
backtest
Strategy Arguments
| Argument | Default | Description |
|---|---|---|
| v_input_1_hl2 | 0 | Price Data (hl2): hl2 |
| v_input_2 | true | ===HMA-Kahlman Trend Module=== |
| v_input_3 | 22 | Lookback Window |
| v_input_4 | true | Use Kahlman |
| v_input_5 | 0.7 | Gain |
| v_input_6 | true | Show Labels? |
| v_input_7 | true | Use Offset |
| v_input_8 | true | ===Trendlines Module=== |
| v_input_9 | 2 | Pivots Lookback Window |
Source (PineScript)
/*backtest
start: 2022-04-12 00:00:00
end: 2022-05-11 23:59:00
period: 2h
basePeriod: 15m
exchanges: [{"eid":"Futures_Binance","currency":"BTC_USDT"}]
*/

//@version=4
study("BRAHMASTRA", precision=2, overlay=true)
// compilation: capissimo

// This script utilizes two modules, Trendlines Module (by Joris Duyck) and HMA-Kahlman Trend Module.
// Trendlines module produces crossovers predictive of the next local trend.

//*** HMA-Kahlman Trend Module
price  = input(hl2,  "Price Data (hl2)")
hkmod  = input(true, "===HMA-Kahlman Trend Module===")
length = input(22,   "Lookback Window", minval=2)
k      = input(true, "Use Kahlman")
gain   = input(.7,   "Gain", minval=.0001, step=.01)
labels = input(true, "Show Labels?")
o      = input(true, "Use Offset")

hma(x, p) => wma((2 * wma(x, p / 2)) - wma(x, p), round(sqrt(p)))

hma3() => p = length/2, wma(wma(close, p/3)*3 - wma(close, p/2) - wma(close, p), p)

kahlman(x, g) =>
    kf = 0.0
    dk = x - nz(kf[1], x)
    smooth = nz(kf[1],x)+dk*sqrt(g*2)
    velo = 0.0
    velo := nz(velo[1],0) + (g*dk)
    kf := smooth+velo

a = k ? kahlman(hma(price, length), gain) : hma(price, length)
b = k ? kahlman(hma3(), gain) : hma3()
c = b > a ? color.lime : color.red
crossdn = a > b and a[1] < b[1]
crossup = b > a and b[1] < a[1]
ofs = o ? -1 : 0

fill(plot(a,color=c,linewidth=1,transp=75), plot(b,color=c,linewidth=1,transp=75), color=c, transp=55)
plotshape(labels and crossdn ? a : na, location=location.abovebar, style=shape.labeldown, color=color.red, size=size.tiny, text="S", textcolor=color.white, transp=0, offset=ofs)
plotshape(labels and crossup ? a : na, location=location.belowbar, style=shape.labelup, color=color.green, size=size.tiny, text="B", textcolor=color.white, transp=0, offset=ofs)

//*** Trendlines Module, see https://www.tradingview.com/script/mpeEgn5J-Trendlines-JD/
tlmod = input(true, "===Trendlines Module===")
l1    = input(2,    "Pivots Lookback Window", minval=1)

trendline(input_function, delay, only_up) => // Calculate line coordinates (Ax,Ay) - (Bx,By)
    var int Ax = 0, var int Bx = 0, var float By = 0.0, var float slope = 0.0
    Ay = fixnan(input_function)
    if change(Ay)!=0
        Ax := time[delay], By:= Ay[1], Bx := Ax[1]
        slope := ((Ay-By)/(Ax-Bx))
    else
        Ax := Ax[1], Bx := Bx[1], By := By[1]

    var line trendline=na, var int Axbis=0, var float Aybis=0.0, var bool xtend=true
    extension_time = 0
    Axbis := Ax + extension_time
    Aybis := (Ay + extension_time*slope)
    if tlmod and change(Ay)!=0
        line_color = slope*time<0?(only_up?na:color.red):(only_up?color.lime:na)
        if not na(line_color)
            trendline = line.new(Bx,By,Axbis, Aybis, xloc.bar_time, extend=xtend?extend.right:extend.none, color=line_color, style=line.style_dotted, width=1)
            line.delete(trendline[1])
    slope

pivot(len) =>
    high_point = pivothigh(high, len,len/2)
    low_point  = pivotlow(low, len,len/2)
    slope_high = trendline(high_point, len/2,false)
    slope_low  = trendline(low_point, len/2,true)
    [high_point, low_point, slope_high, slope_low]

[high_point1, low_point1, slope_high1, slope_low1] = pivot(l1)

color_high1 = slope_high1 * time<0 ? color.red : na
color_low1  = slope_low1  * time>0 ? color.lime : na
plot(tlmod ? high_point1 : na, color=color_high1, offset=-l1/2, linewidth=2)
plot(tlmod ? low_point1  : na, color=color_low1, offset=-l1/2, linewidth=2)


if crossup
    strategy.entry("Enter Long", strategy.long)
else if crossdn
    strategy.entry("Enter Short", strategy.short)
Detail
https://www.fmz.com/strategy/362870
Last Modified
2022-05-13 15:26:38