Name
BB双重多空头交易策略BB-Dual-Long-and-Short-Trading-Strategy
Author
ChaoZhang
Strategy Description
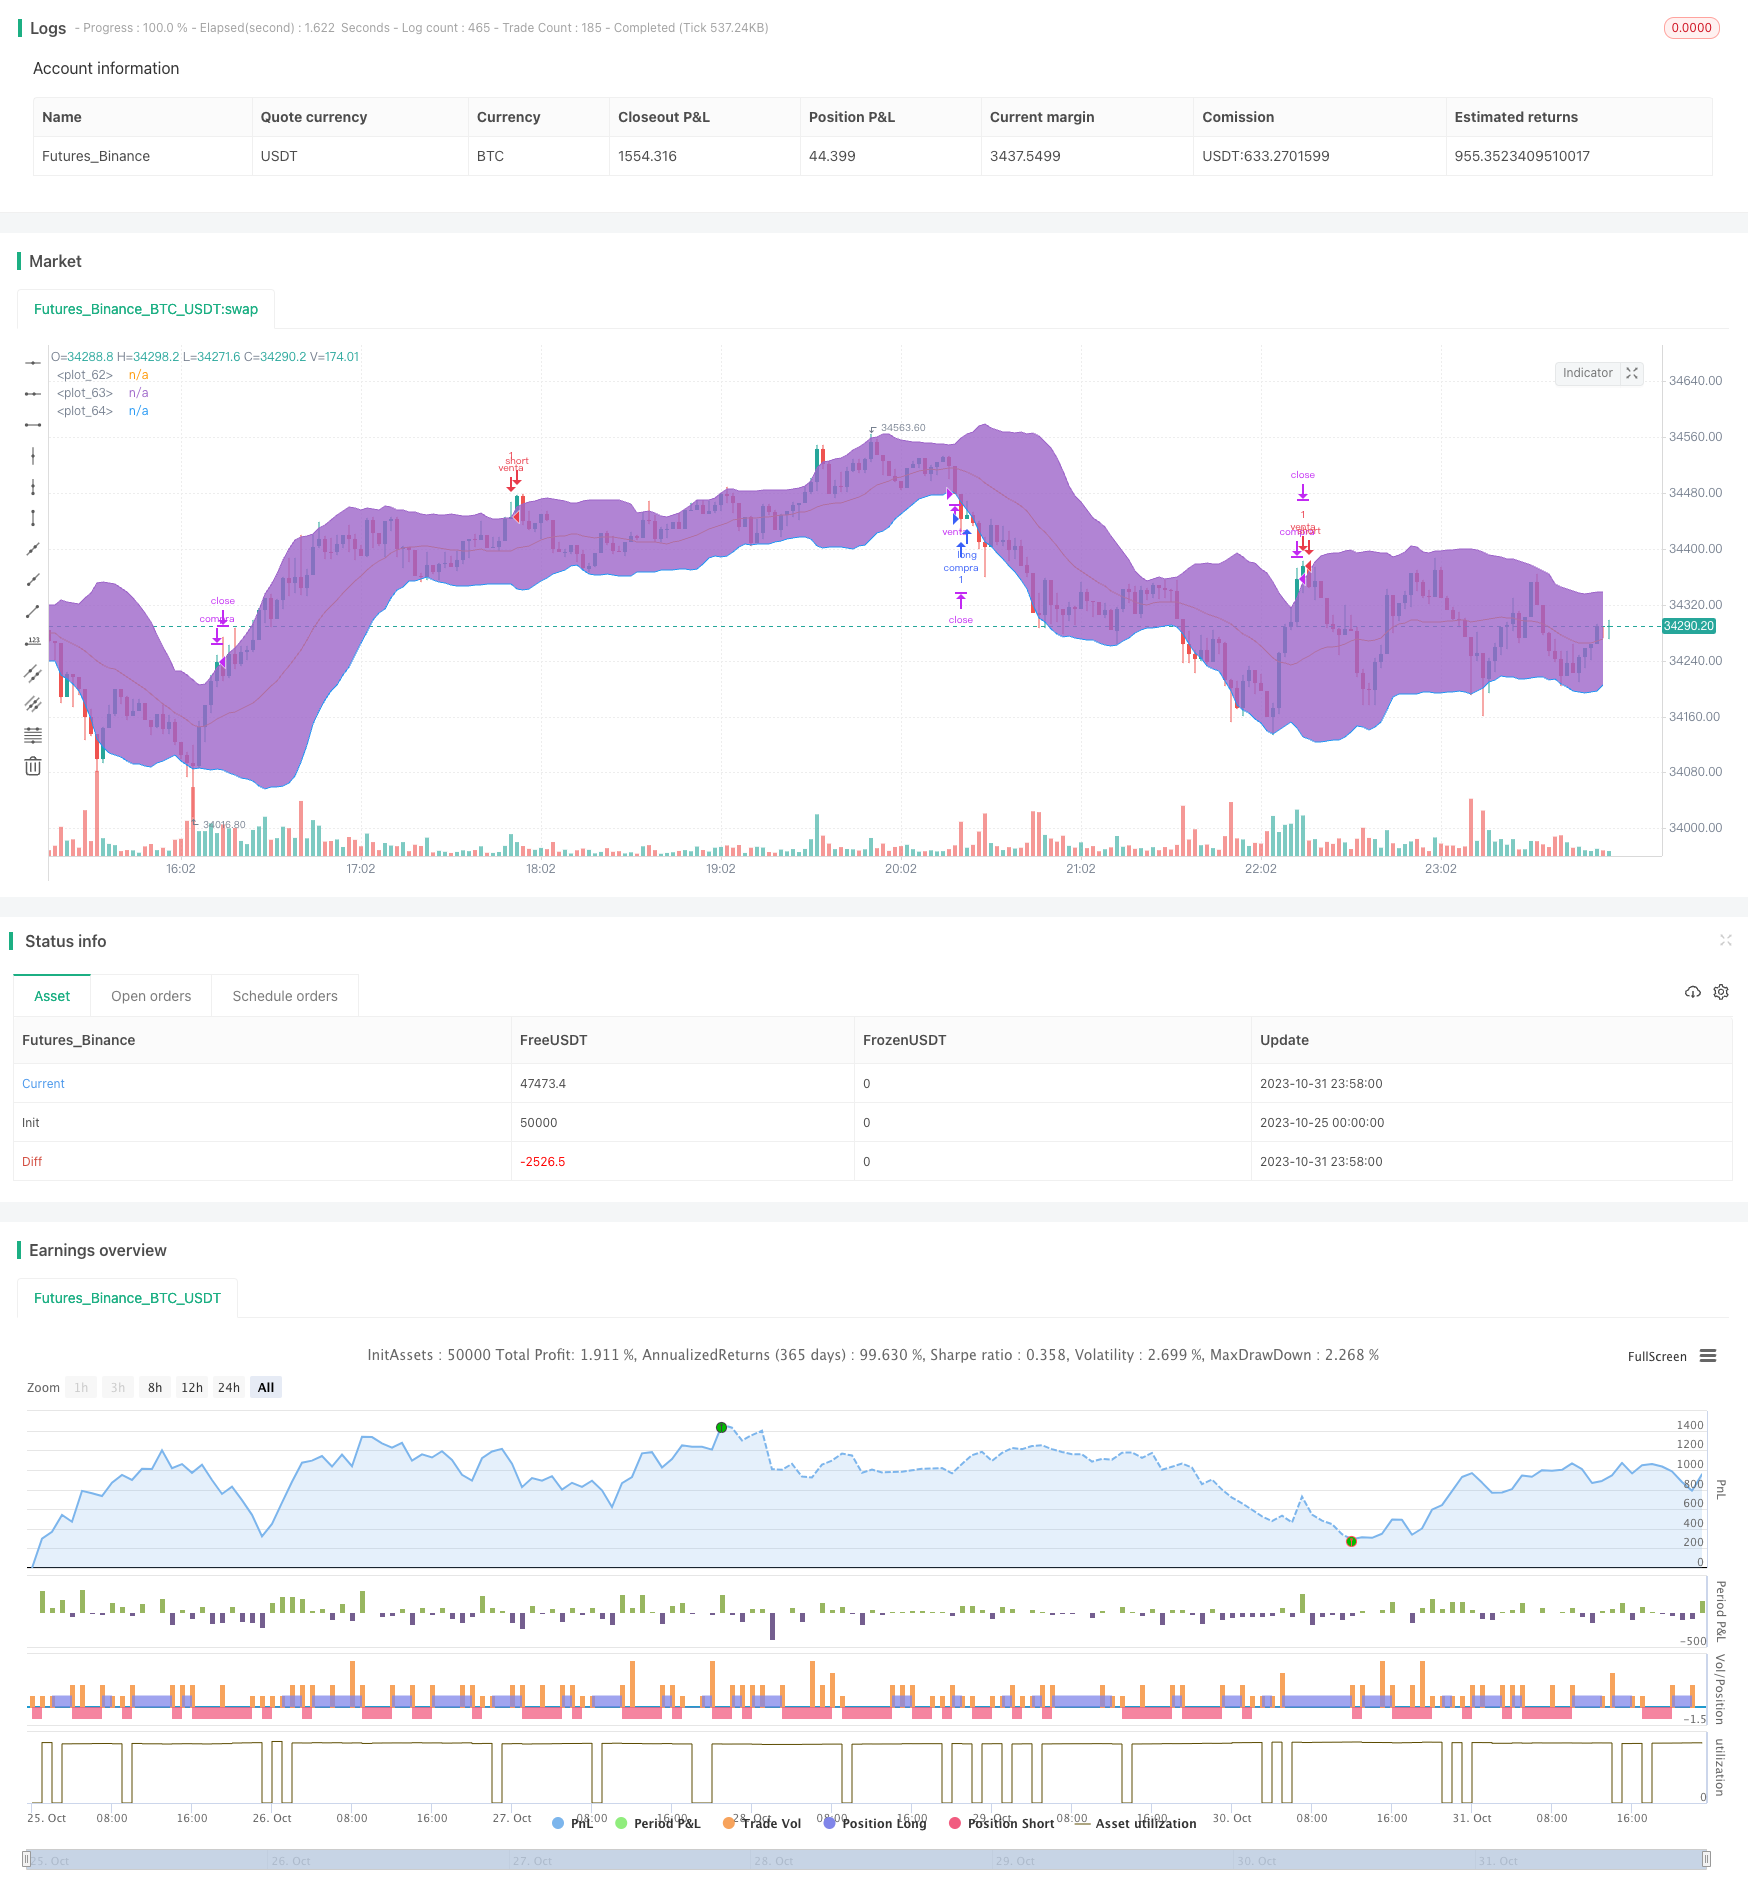
BB双重多空头交易策略是一个利用布林带进行双向交易的策略。它结合布林中轨、上轨和下轨,实现多空头双向开仓和平仓。当价格触碰上轨时开空头仓位,触碰下轨时开多头仓位,并设置止损和止盈价格。策略简单易操作,能够抓住市场的主要趋势。
该策略主要基于布林带的原理。布林带由中轨、上轨和下轨组成,代表价格的移动趋势。中轨是n日移动平均线,上轨是中轨+k倍标准差,下轨是中轨-k倍标准差。当价格突破上轨时,表示市场处于超买状态,应该考虑开空头仓位;当价格跌破下轨时,表示市场处于超卖状态,应该考虑开多头仓位。
具体来看,该策略首先计算布林中轨、上轨和下轨。然后判断价格是否触碰上轨,如果触碰,则开空头仓位;判断价格是否触碰下轨,如果触碰,则开多头仓位。开仓后还设置了止损和止盈价格。例如开多仓位后,止损价格为开仓价格减去一定比例,止盈价格为开仓价格加上一定比例。最后,策略还定义了平仓条件,包括止损、止盈跳动和布林带重新进入区间等条件。
整个策略充分利用了布林带反映市场超买超卖的特点,实现了较为精确的多空头交易。当市场处于不同阶段时,也可以通过布林带指标判断目前的行情走势,从而采取相应的交易策略。
该策略具有以下优势:
-
捕捉趋势,布林带能识别主要趋势方向,及时开仓捕捉趋势。
-
双向交易,可以同时进行多头和空头交易,不受限于单边方向。
-
风险控制,设置止损和止盈确保每个交易都有挡损措施。
-
简单明了,基于布林带指标,策略规则直接易于理解。
-
容易优化,通过调整参数如周期长度、标准差倍数等可以优化策略。
-
适用于不同市场,可适用于股票、外汇、加密货币等市场。
该策略也存在一些风险:
-
布林带失效风险,行情剧烈波动时布林带可能失效。
-
止损被突破风险,行情趋势变化剧烈时止损可能被突破。
-
策略过优化风险,过度优化策略可能导致过拟合。
-
交易频率过高风险,布林带波动频繁时将过于频繁交易。
-
分位离场风险,仅依靠布林带分位可能导致过早离场。
对应的解决方法:
-
结合趋势指标,判断布林带失效后及时关闭策略。
-
采用移动止损,让止损跟踪价格。
-
多市场多时间框架回测,防止过优化。
-
适当放宽布林带波动范围,减少交易频率。
-
新增离场指标,如MACD等确认布林带信号。
该策略可以从以下几个方面进行优化:
-
调整布林带参数,如调整周期参数以匹配不同周期行情,调整标准差倍数以适应市场波动率。
-
增加趋势过滤,结合移动平均线等指标判断趋势,避免布林带在无明确趋势时的错误信号。
-
优化止损策略,如移动止损让止损更紧跟价格,或根据ATR设置止损幅度。
-
增加入场过滤,如收盘价突破布林带等,避免布林带指标的中间假突破。
-
利用机器学习技术自动优化参数,实现参数智能调整。
-
增加离场指标,如MACD等指标的背离作为辅助布林带信号的离场指标。
BB双重多空头交易策略整体来说是一个非常典型且实用的布林带策略。它利用布林带指标判断超买超卖来捕捉市场趋势,并进行双向交易,同时设置止盈止损来控制风险。该策略具有捕捉趋势、双向交易、风险控制的优势,也存在布林带失效等问题。我们可以通过调整布林带参数、增加趋势过滤、优化止损策略等方法来提高策略的效果。该策略有很强的实用性和发展潜力,是一种值得推荐的简单实用的交易策略。
||
The BB dual long and short trading strategy is a strategy that utilizes Bollinger Bands for two-way trading. It combines the middle band, upper band and lower band of the Bollinger Bands to implement opening and closing long and short positions. It opens short positions when the price touches the upper band, and opens long positions when it touches the lower band, with stop loss and take profit prices set. The strategy is simple to operate and captures the main trends of the market.
This strategy is mainly based on the principle of Bollinger Bands. Bollinger Bands consist of a middle band, an upper band and a lower band, representing the moving trend of prices. The middle band is the n-day moving average, the upper band is the middle band + k standard deviations, and the lower band is the middle band - k standard deviations. When the price breaks through the upper band, it indicates the market is in an overbought state, and opening short positions should be considered; when the price breaks through the lower band, it indicates the market is in an oversold state, and opening long positions should be considered.
Specifically, the strategy first calculates the Bollinger middle, upper and lower bands. It then judges if the price touches the upper band. If yes, it opens short positions. It also judges if the price touches the lower band. If yes, it opens long positions. After opening positions, it also sets stop loss and take profit prices. For example, after opening long positions, the stop loss price would be the opening price minus a certain percentage, and the take profit price would be the opening price plus a certain percentage. Finally, the strategy also defines the closing conditions, including stop loss, take profit being hit, and the price re-entering the Bollinger Bands.
The strategy fully utilizes the ability of Bollinger Bands to reflect overbought and oversold market conditions, and implements relatively accurate long and short trading. When the market is in different stages, the trend of current market conditions can also be judged through Bollinger Bands indicators, and corresponding trading strategies can be adopted.
The strategy has the following advantages:
-
Catching trends. Bollinger Bands can identify the main trend direction and open positions in time to capture trends.
-
Two-way trading. It allows simultaneous long and short trading, without being limited to one direction.
-
Risk control. Stop loss and take profit setup ensures each trade has loss mitigation measures.
-
Simple and clear. Based on the Bollinger Bands indicator, the strategy rules are direct and easy to understand.
-
Easy to optimize. Parameters like cycle length and standard deviation multiplier can be adjusted to optimize the strategy.
-
Applicable to different markets. Can be applied to stocks, forex, cryptocurrencies etc.
The strategy also has some risks:
-
Bollinger Bands failure risk. Bollinger Bands may fail during violent market fluctuations.
-
Stop loss being hit risk. Stop loss may be hit during drastic trend changes.
-
Over-optimization risk. Excessive optimization may lead to overfitting.
-
High trading frequency risk. Frequent Bollinger Bands fluctuations may lead to over-trading.
-
Band touch exit risk. Exiting solely based on band touch may be premature.
The solutions are:
-
Combine with trend indicators, close strategy in time when bands fail.
-
Adopt trailing stop loss.
-
Backtest across markets and timeframes to prevent overfitting.
-
Relax the fluctuation range to reduce trade frequency.
-
Add exit indicators like MACD divergence to confirm bands signal.
The strategy can be optimized in the following aspects:
-
Adjust Bollinger parameters like cycle length to match different cycle trends, and standard deviation multiplier to suit market volatility.
-
Add trend filter, combine indicators like moving average to determine trend, avoid false signals when no clear trend.
-
Optimize stop loss strategy, like trailing stop loss to track price closer, or set stop loss based on ATR.
-
Add entry filters like closing price breaking bands to avoid mid-band false breakouts.
-
Use machine learning to auto optimize parameters.
-
Add exit indicators like MACD divergence to supplement band signals.
Overall, the BB dual long and short trading strategy is a very typical and practical Bollinger Bands strategy. It uses the Bollinger Bands to judge overbought and oversold conditions to capture trends, implements two-way trading, and sets stop loss and take profit for risk control. The strategy has the advantages of catching trends, two-way trading, and risk control, and also has problems like Bollinger Bands failure. We can improve the strategy by adjusting Bollinger parameters, adding trend filters, optimizing stop loss etc. The strategy has great practicality and potential, and is a simple useful trading strategy worth recommending.
[/trans]
Strategy Arguments
| Argument | Default | Description |
|---|---|---|
| v_input_1 | 20 | Longitud |
| v_input_float_1 | 2 | Desvio estandar |
| v_input_2_close | 0 | Fuente: close |
| v_input_float_2 | 5 | Take Profit |
| v_input_float_3 | true | Stop Loss |
Source (PineScript)
/*backtest
start: 2023-10-25 00:00:00
end: 2023-11-01 00:00:00
period: 2m
basePeriod: 1m
exchanges: [{"eid":"Futures_Binance","currency":"BTC_USDT"}]
*/

// This source code is subject to the terms of the Mozilla Public License 2.0 at https://mozilla.org/MPL/2.0/
// © samuelkanneman

//@version=5
strategy('MI_BB ', overlay=true)
// i_startTime = input.time(title='Start Date Filter', defval=timestamp('01 Nov 2020 13:30 +0000'), tooltip='Date & time to begin trading from')
// i_endTime = input.time(title='End Date Filter', defval=timestamp('1 Nov 2022 19:30 +0000'), tooltip='Date & time to stop trading')

dateFilter = true

longitud = input(20, title='Longitud')
Desv = input.float(2.0, title='Desvio estandar', step=0.1)
fuente = input(close, title='Fuente')

TakeP = input.float(5.0, title='Take Profit', step=0.1)
StopL = input.float(1.0, title='Stop Loss', step=0.1)
var SL = 0.0
var TP = 0.0

[banda_central, banda_sup, banda_inf] = ta.bb(fuente, longitud, Desv)

comprado = strategy.position_size > 0
vendido = strategy.position_size < 0


if not vendido and not comprado and dateFilter
// Short
    if close >= banda_sup
    //cantidad= (strategy.equity/close)
        strategy.entry('venta', strategy.short)
        SL := close * (1 + StopL / 100)
        TP := close*(1-TakeP/100)

//Long
    else if close <= banda_inf
    //cantidad= (strategy.equity/close)
        strategy.entry('compra', strategy.long)
        SL := close * (1 - StopL / 100)
        TP := close*(1+TakeP/100)

//cierrres short
if close <= TP and vendido
    strategy.close ("venta" , comment="Salto TP")
if close <= banda_inf and vendido
    strategy.close ("venta" , comment="Banda Inferior")
if close >= SL and vendido
    strategy.close ("venta" , comment="Salto SL")


//cierre long
if close >= TP and comprado
    strategy.close ("compra" , comment="Salto TP")
if close >= banda_sup and comprado
    strategy.close ("compra" , comment="Banda Superior")

if close <= SL and comprado
    strategy.close ("compra" , comment="Salto SL")


p1 = plot(banda_central)
p2 = plot(banda_sup)
p3 = plot(banda_inf)
fill(p2, p3, transp=90)
Detail
https://www.fmz.com/strategy/430868
Last Modified
2023-11-02 15:40:00