Name
Algorithm-RSI区间突破策略Algorithm-RSI-Range-Breakout-Strategy
Author
ChaoZhang
Strategy Description
[trans]
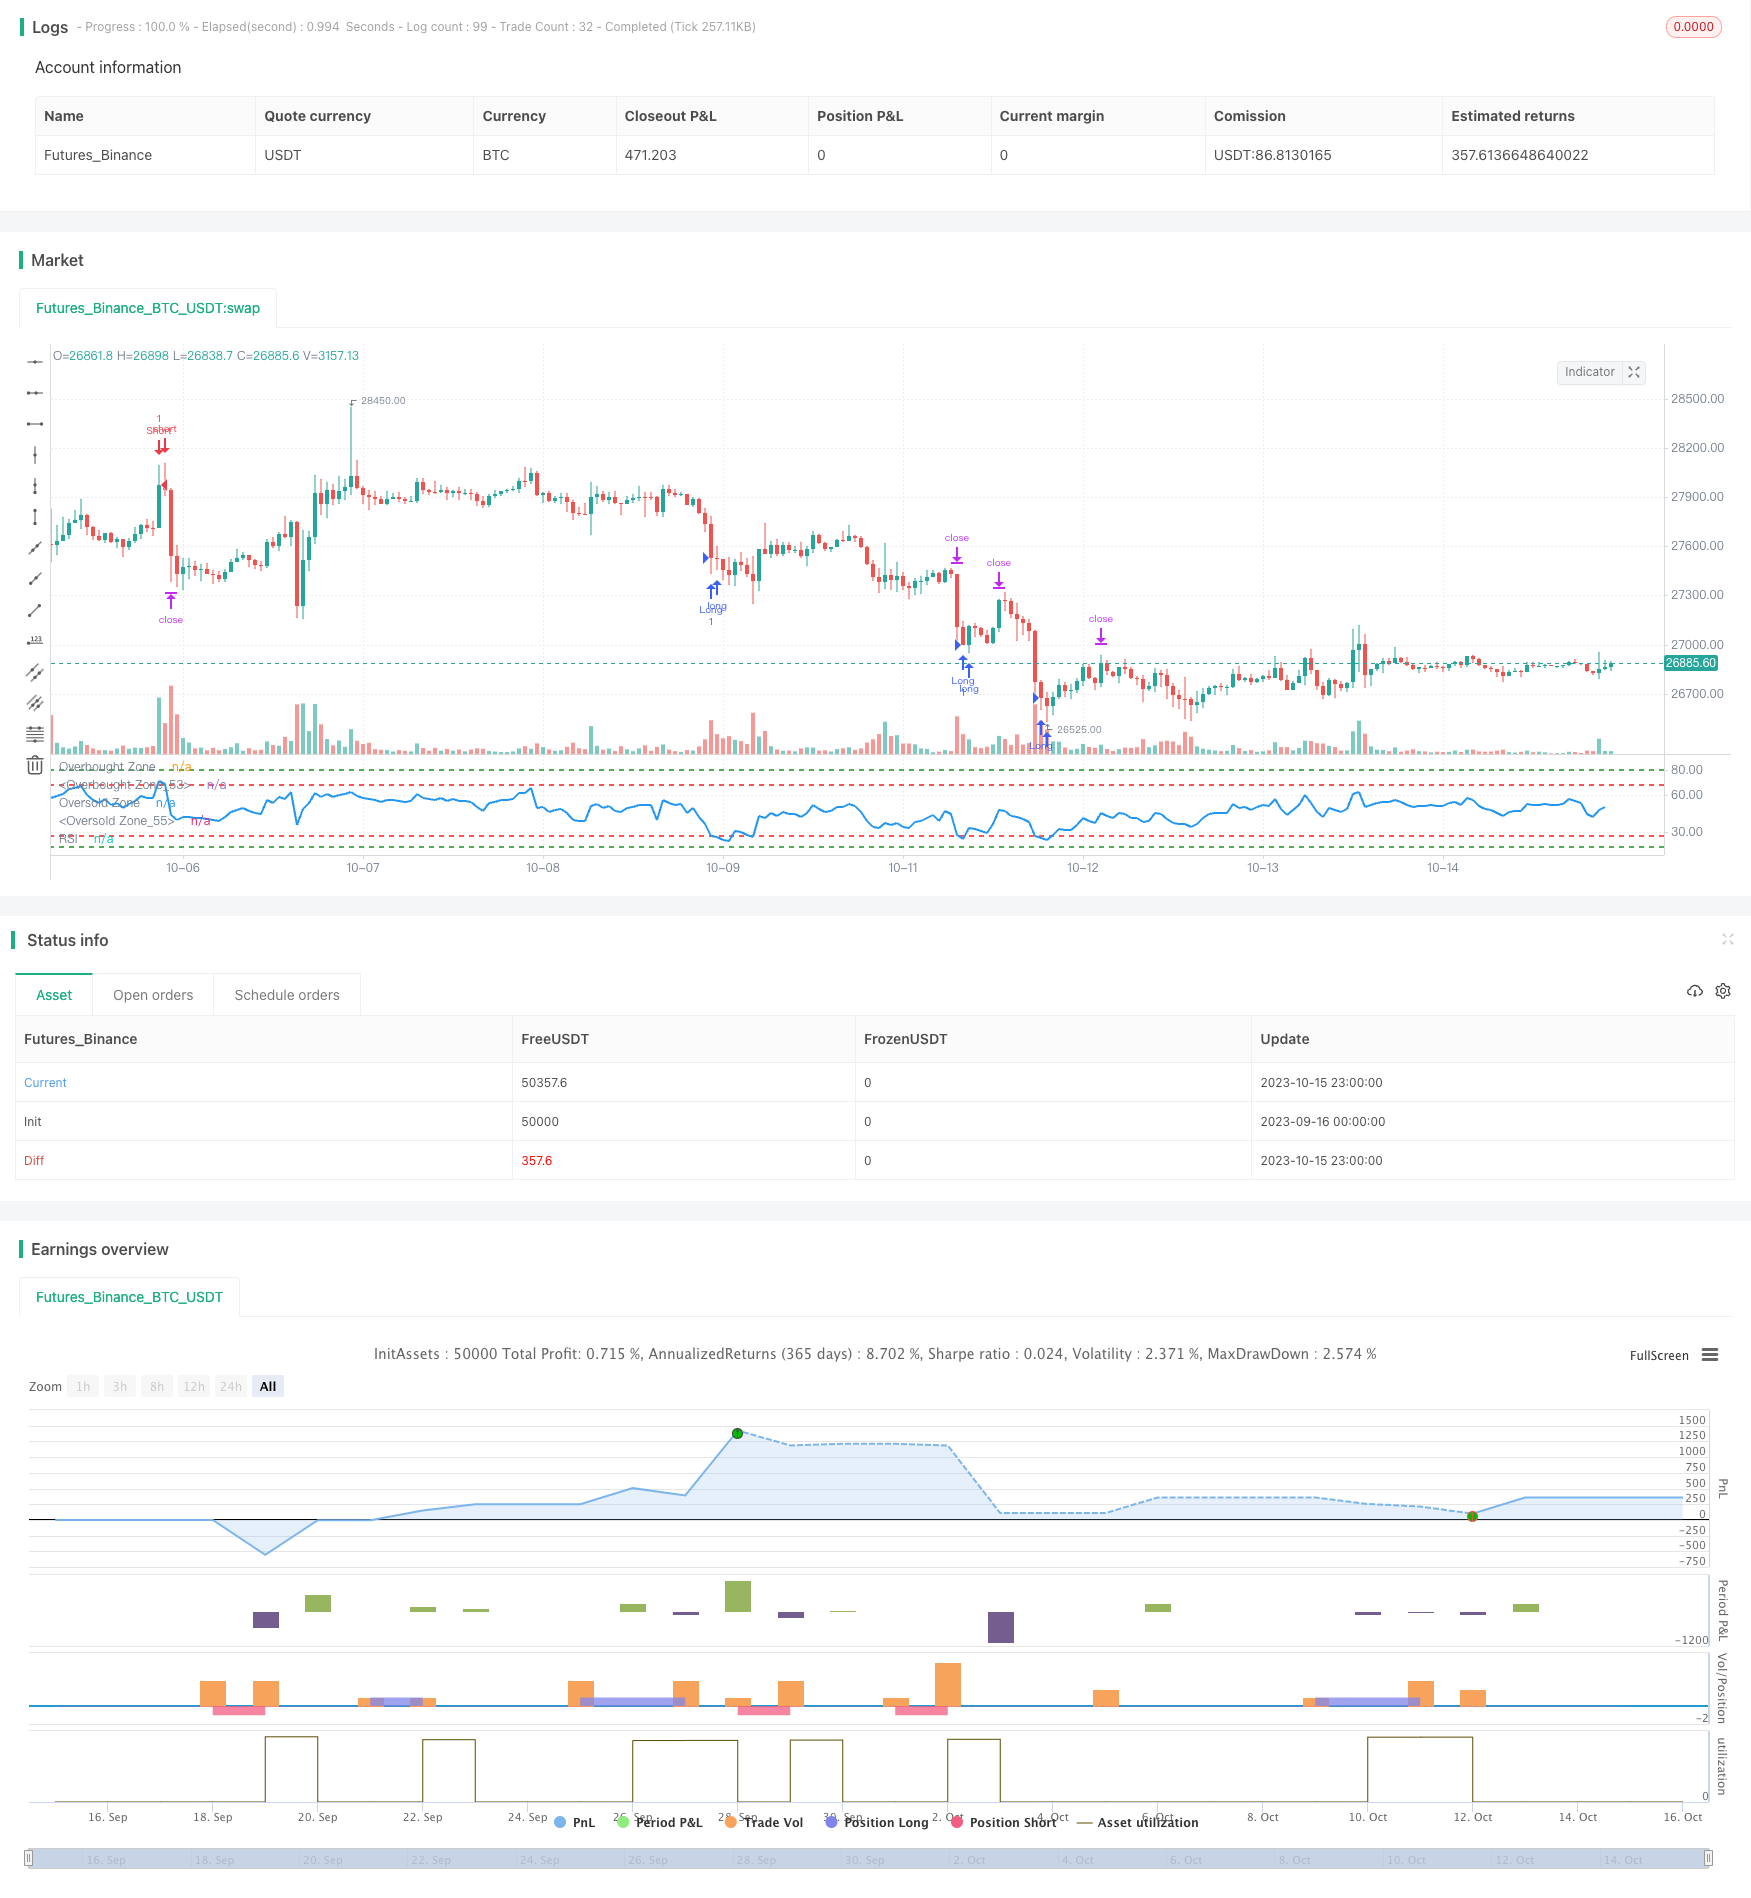
本策略通过监控RSI指标在不同区间的突破,实现低买高卖的目的。当RSI位于低位区间时买入,当RSI位于高位区间时卖出,从而在超买超卖现象出现时进行反向操作。
-
设置RSI的长度为14周期
-
设置买入信号的RSI区间:
- 区间1: RSI <= 27
- 区间2: RSI <= 18
-
设置卖出信号的RSI区间:
- 区间1: RSI >= 68
- 区间2: RSI >= 80
-
当RSI进入买入区间时,做多入场:
- 如果RSI进入区间1(27以下),做多1手
- 如果RSI进入区间2(18以下),额外做多1手
-
当RSI进入卖出区间时,做空入场:
- 如果RSI进入区间1(68以上),做空1手
- 如果RSI进入区间2(80以上),额外做空1手
-
每次开仓固定止盈2500点,止损5000点
-
RSI离开信号区间后,平掉相关仓位
-
双区间设定使策略能更清楚判断超买超卖现象,避免错过反转机会
-
采用固定止盈止损点数设置,不会过于追涨杀跌
-
RSI是一种比较成熟的超买超卖判断指标,相比其他指标更有优势
-
本策略参数设置合理时,能够有效捕捉趋势反转点,获取超额收益
-
RSI指标可能出现失效的市场,从而导致系统持续做空亏损
-
固定止盈止损点数设置可能与市场波动幅度不匹配,无法获利或过早止损
-
区间设置不合理可能导致错过交易机会或频繁交易亏损
-
本策略较依赖参数优化,需要注意测试周期及滑点控制
-
可以测试不同长度周期的RSI指标效果
-
可以优化买卖区间的数值,使其更符合不同品种的特点
-
可以研究动态止盈止损方式,使止盈更有效,止损更合理
-
可以考虑结合其他指标进行组合交易,提高系统稳定性
-
可以探索机器学习方式自动优化区间参数,使策略更具鲁棒性
本策略基于RSI指标的超买超卖判断原理设计。通过设置双买卖区间发挥RSI指标的效用,在保持一定的稳定性的同时,能够有效捕捉市场的超买超卖现象进行反向操作。但本策略也存在一定的参数依赖性,需要针对不同品种进行优化测试。如果参数设定得当,本策略可以获取不错的超额收益。总体来说,本策略是一个利用成熟指标的简单有效的交易策略,值得进一步研究优化,也为量化交易策略提供了思路。
||
This strategy monitors the breakout of RSI indicator in different ranges to implement buying low and selling high. It goes long when RSI is in the low range and goes short when RSI is in the high range, thus reversing position when overbought or oversold conditions appear.
-
Set RSI period to 14
-
Set RSI buy signal ranges:
- Range 1: RSI <= 27
- Range 2: RSI <= 18
-
Set RSI sell signal ranges:
- Range 1: RSI >= 68
- Range 2: RSI >= 80
-
When RSI enters buy range, go long:
- If RSI enters range 1 (below 27), go long 1 lot
- If RSI enters range 2 (below 18), go additional long 1 lot
-
When RSI enters sell range, go short:
- If RSI enters range 1 (above 68), go short 1 lot
- If RSI enters range 2 (above 80), go additional short 1 lot
-
Set fixed take profit to 2500 pips and stop loss to 5000 pips
-
Close position when RSI exits signal range
-
The double range setting helps better identify overbought and oversold conditions, avoiding missing reversal opportunities
-
Adopting fixed take profit and stop loss in pips prevents chasing trends too much
-
RSI is a mature oscillator in identifying overbought and oversold levels with advantages over other indicators
-
With proper parameter tuning, this strategy can effectively catch trend reversal points and generate excess returns
-
RSI divergence may happen leading to consecutive losses from sustained short position
-
Fixed take profit and stop loss may not match market volatility, unable to profit or stopping out prematurely
-
Improper range setting may lead to missing trades or frequent unprofitable trades
-
This strategy relies much on parameter optimization based on backtests. Careful walk-forward analysis is needed.
-
Test effectiveness of RSI with different period lengths
-
Optimize buy and sell range values to fit characteristics of different products
-
Research dynamic take profit and stop loss to improve profitability and reasonability
-
Consider combining other indicators for ensemble trading to improve robustness
-
Explore machine learning techniques to auto-optimize parameter ranges for robustness
This strategy is based on RSI's overbought and oversold principles. By adopting double trading ranges, it utilizes RSI indicator effectively, capturing market extremes with decent stability. However, it has some parameter reliance and needs optimization across products. If tuned properly, this strategy can yield good excess returns. In summary, it is a simple yet effective trading strategy using a mature indicator, worth researching for improvements and providing insights for quantitative trading.
[/trans]
Strategy Arguments
| Argument | Default | Description |
|---|---|---|
| v_input_1 | 14 | Length |
| v_input_2 | 27 | Buy Level 1 |
| v_input_3 | 18 | Buy Level 2 |
| v_input_4 | 68 | Sell Level 1 |
| v_input_5 | 80 | Sell Level 2 |
| v_input_6 | 2500 | target Pips |
| v_input_7 | 5000 | Stop Pips |
| v_input_8 | true | Lot Size |
Source (PineScript)
/*backtest
start: 2023-09-16 00:00:00
end: 2023-10-16 00:00:00
period: 1h
basePeriod: 15m
exchanges: [{"eid":"Futures_Binance","currency":"BTC_USDT"}]
*/

// This source code is subject to the terms of the Mozilla Public License 2.0 at https://mozilla.org/MPL/2.0/
// © Rawadabdo

// Ramy's Algorithm

//@version=5
strategy("BTC/USD - RSI", overlay=false, initial_capital = 5000)

// User input
length = input(title = "Length", defval=14, tooltip="RSI period")

first_buy_level = input(title = "Buy Level 1", defval=27, tooltip="Level where 1st buy triggers")
second_buy_level = input(title = "Buy Level 2", defval=18, tooltip="Level where 2nd buy triggers")

first_sell_level = input(title = "Sell Level 1", defval=68, tooltip="Level where 1st sell triggers")
second_sell_level = input(title = "Sell Level 2", defval=80, tooltip="Level where 2nd sell triggers")

takeProfit= input(title="target Pips", defval=2500, tooltip="Fixed pip stop loss distance")
stopLoss = input(title="Stop Pips", defval=5000, tooltip="Fixed pip stop loss distance")

lot = input(title = "Lot Size", defval = 1, tooltip="Trading Lot size")

// Get RSI
vrsi = ta.rsi(close, length)

// Entry Conditions
long1 = (vrsi <= first_buy_level and vrsi>second_buy_level)
long2 = (vrsi <= second_buy_level)

short1= (vrsi >= first_sell_level and vrsi<second_sell_level)
short2= (vrsi >= second_sell_level)


// Entry Orders
// Buy Orders
if (long1 and strategy.position_size == 0)
    strategy.entry("Long", strategy.long, qty=lot, comment="Buy")
    if (long2 and  strategy.position_size == 0)
        strategy.entry("Long", strategy.long, qty=lot, comment="Buy")

// Short Orders
if (short1 and strategy.position_size == 0)
    strategy.entry("Short", strategy.short,qty=lot, comment="Sell")
    if (short2 and strategy.position_size == 0)
        strategy.entry("Short", strategy.short,qty=lot, comment="Sell")

// Exit our trade if our stop loss or take profit is hit
strategy.exit(id="Long Exit", from_entry="Long",qty = lot, profit=takeProfit, loss=stopLoss)
strategy.exit(id="Short Exit", from_entry="Short", qty = lot, profit=takeProfit, loss=stopLoss)

// plot data to the chart
hline(first_sell_level, "Overbought Zone", color=color.red, linestyle=hline.style_dashed, linewidth = 2)
hline(second_sell_level, "Overbought Zone", color=color.green, linestyle=hline.style_dashed, linewidth = 2)
hline(first_buy_level, "Oversold Zone", color=color.red, linestyle=hline.style_dashed, linewidth = 2)
hline(second_buy_level, "Oversold Zone", color=color.green, linestyle=hline.style_dashed, linewidth = 2)
plot (vrsi, title = "RSI", color = color.blue, linewidth=2)
Detail
https://www.fmz.com/strategy/429509
Last Modified
2023-10-17 17:14:09
