Name
ADX智能趋势跟踪策略ADX-Intelligent-Trend-Tracking-Strategy
Author
ChaoZhang
Strategy Description
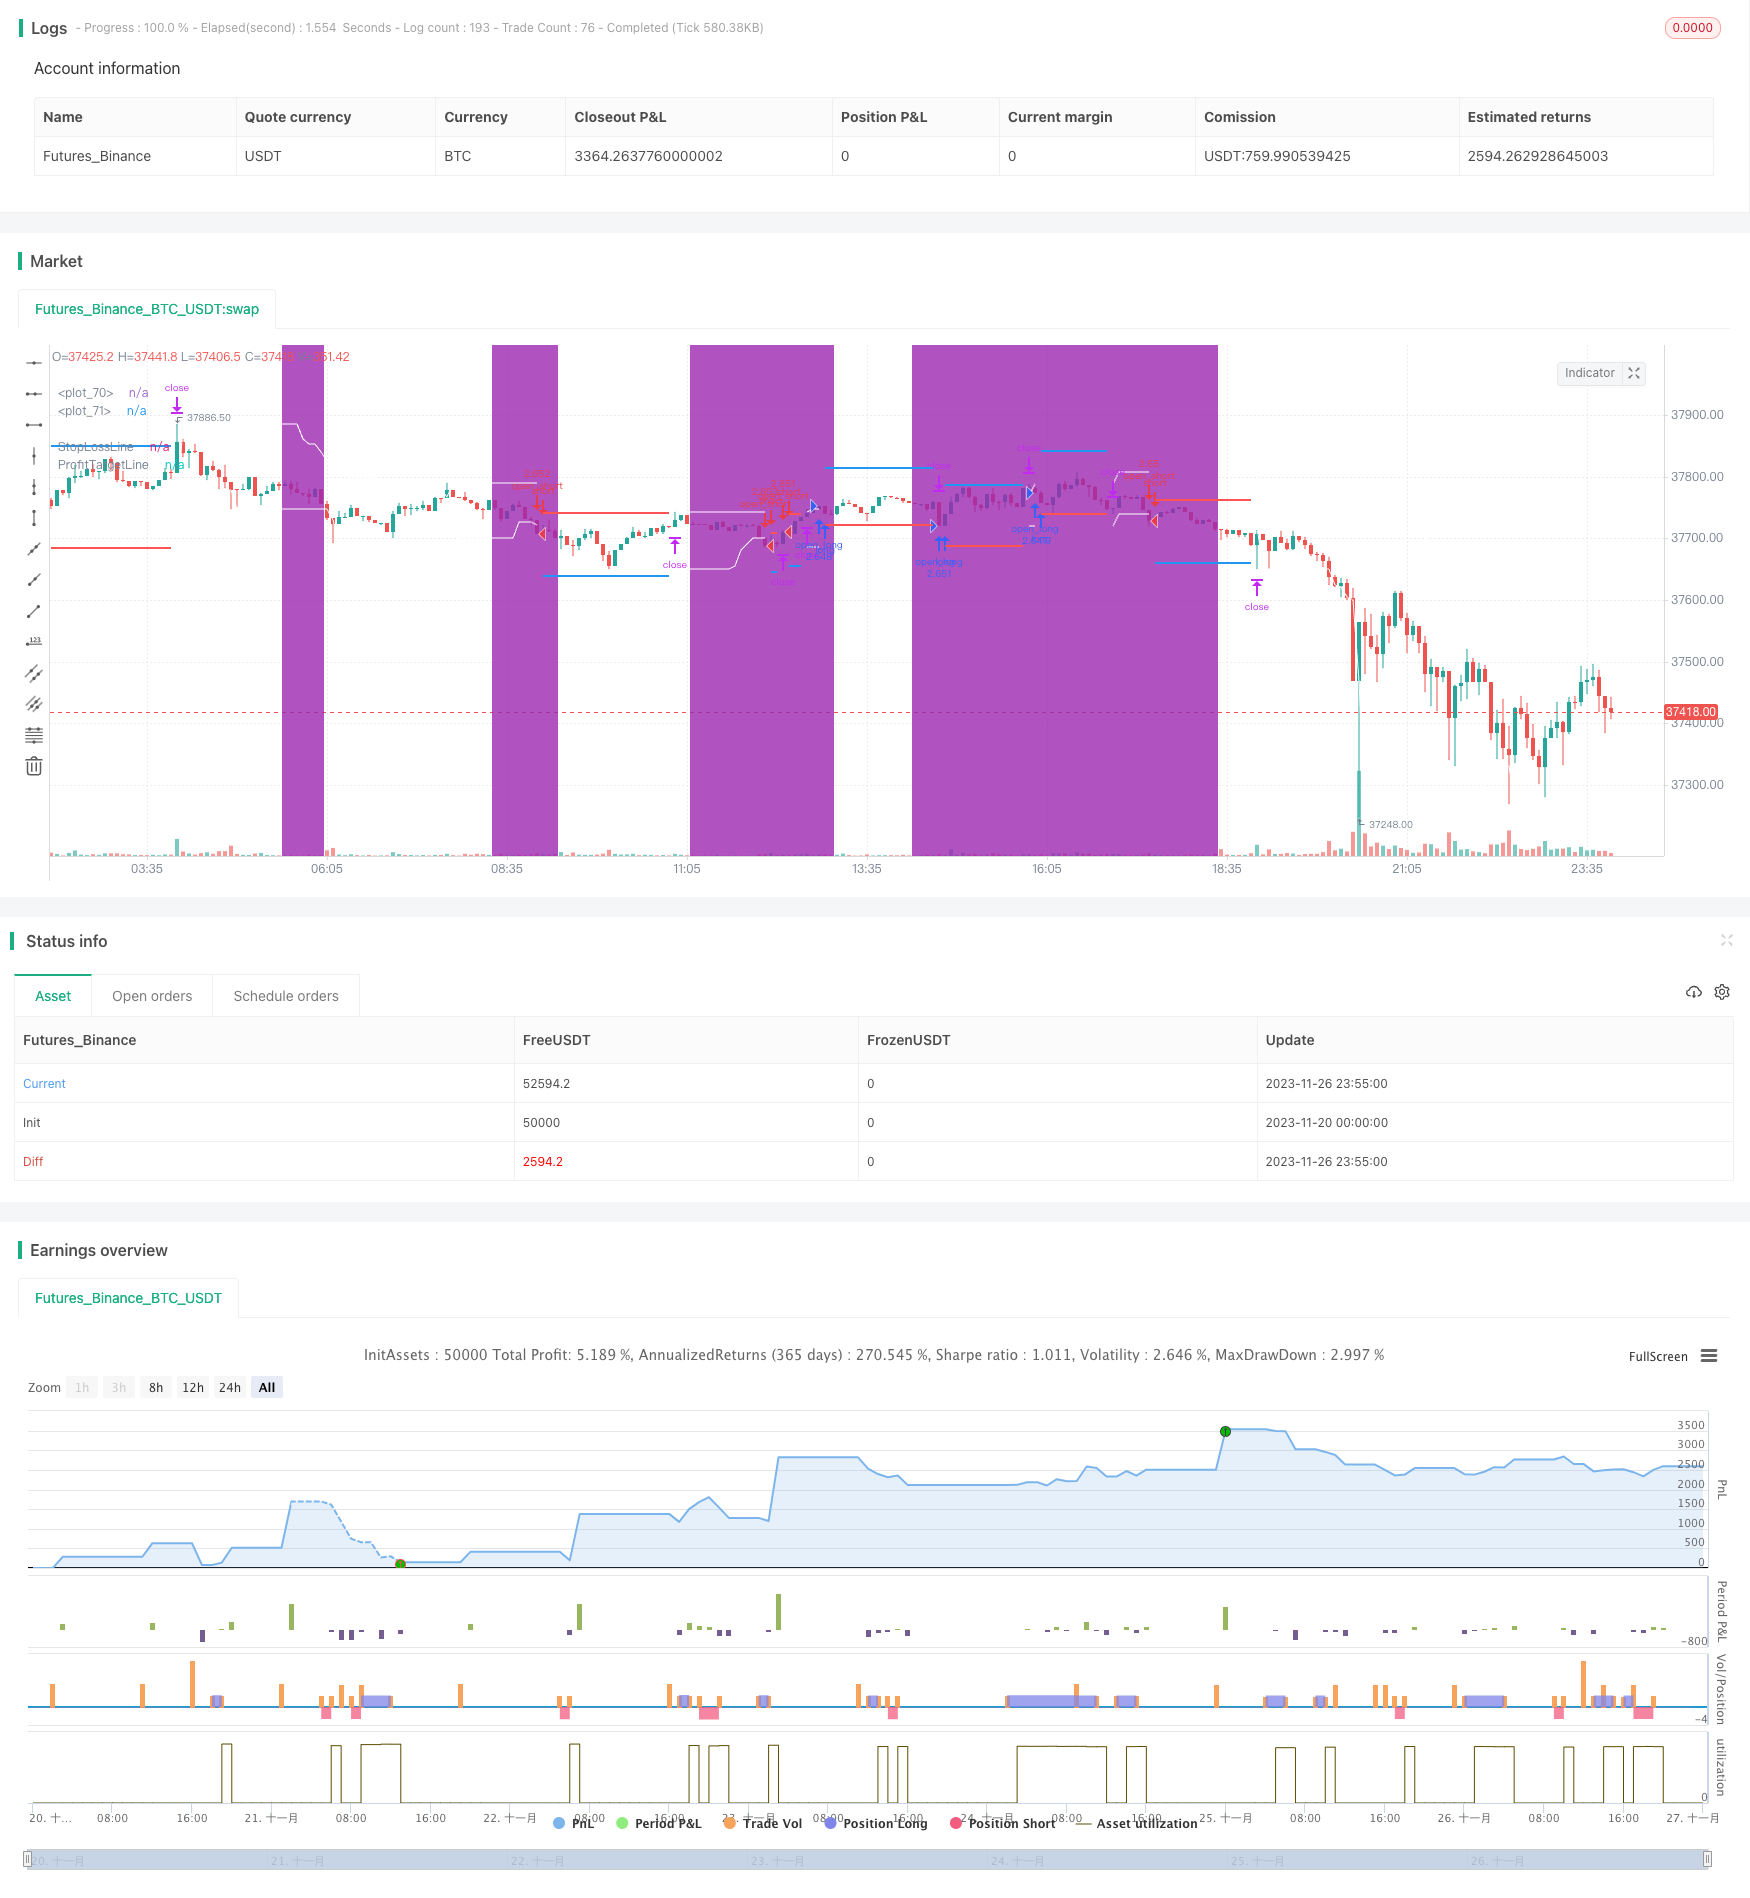
ADX智能趋势跟踪策略利用平均趋向指数(ADX)来判断趋势的力量,在趋势较弱的时候进行趋势捕捉,在强势趋势中进行跟踪获利。该策略判断趋势力量的同时结合价格突破来产生交易信号,属于趋势跟踪策略的一种。
该策略主要基于平均趋向指数(ADX)来判断目前的趋势力量。ADX通过计算一定周期内价格波动的 DIRECTIONAL INDICATOR 的平均值来表示趋势的力量。当ADX值低于设定阈值时,我们认为行情正在整理,这时进行方框范围判定,如果价格突破方框上下轨,产生交易信号。
具体来说,策略首先计算14周期的ADX值,低于18时认为趋势较弱。然后计算过去20根K线的最高价和最低价形成的方框范围。当价格突破该方框时,产生买入和卖出信号。止损距离为方框大小的50%,止盈距离为方框大小的100%。
该策略同时结合了趋势力量判断和突破信号,能够在趋势较弱而进入整理的情况下进行捕捉,避免在无序行情中频繁交易。而当出现强势趋势时,止盈范围较大,能够获得更多利润。
- 结合趋势力量判断,能够避免在无序行情中频繁交易。
- 方框突破增加了一定的过滤,避免在震荡行情中被套。
- 在趋势行情中,能够获得更大的止盈空间。
- 可自定义ADX参数、方框参数、止损止盈系数等,适应不同品种。
- ADX参数设置不当可能错过趋势或判断错误。
- 方框范围过大过小都可能影响效果。
- 止损止盈系数不当可能造成过小止损或止盈太早。
可以通过调整ADX参数、方框参数、止损止盈系数等来优化,使之更适合不同的品种和行情环境。同时严格的资金管理也很重要,控制单笔止损比例,避免单笔大损失。
- ADX参数可以测试不同周期效果。
- 方框参数可以测试不同长度,判断最佳范围大小。
- 止损止盈系数可以微调,优化风险收益比。
- 可以测试仅做多、仅做空的单边交易效果。
- 可以加入其他指标进行组合,如增加量能指标等。
ADX智能趋势跟踪策略总体来说是一种较为稳定的趋势策略。它同时结合了趋势力量判断和价格突破信号,在一定程度上避免了常见趋势跟踪策略中追高杀跌的问题。通过参数优化和严格的资金管理,可以使该策略稳定获利。
||
The ADX Intelligent Trend Tracking Strategy uses the Average Directional Index (ADX) to judge the strength of trends and capture trends when they are weak and follow strong trends for profit. The strategy generates trading signals by judging the strength of trends while combining price breakthroughs and belongs to a type of trend tracking strategy.
The core of this strategy is mainly based on the Average Directional Index (ADX) to judge the current trend strength. ADX calculates the average value of DIRECTIONAL INDICATOR of price fluctuations over a certain period to represent the strength of the trend. When the ADX value is below the set threshold, we believe the market is consolidating. At this time, the box range is determined. If the price breaks through the upper and lower rails of the box, a trading signal is generated.
Specifically, the strategy first calculates the 14-cycle ADX value. When it is lower than 18, it is considered that the trend is weaker. It then calculates the range of the box formed by the highest and lowest prices of the past 20 K-lines. When the price breaks through this box, buy and sell signals are generated. The stop loss distance is 50% of the box size, and the take profit distance is 100% of the box size.
This strategy combines trend strength judgment and breakthrough signals to capture trends when they are weaker and enter a consolidation, avoiding frequent trading in disorderly markets. And when a strong trend appears, the wider profit target can obtain more profits.
- Combining trend strength judgment can avoid frequent trading in disorderly markets.
- Breakthrough of the box increases filtering to avoid being trapped in volatile markets.
- In trend markets, greater profit targets can be obtained.
- Customizable ADX parameters, box parameters, stop loss coefficients, etc. to adapt to different varieties.
- Improper ADX parameter settings may miss trends or make wrong judgments.
- Excessively large or small box ranges can affect results.
- Inappropriate stop loss and take profit coefficients may cause insufficient stop loss or too early profit taking.
Parameters like ADX, box range, stop loss coefficients can be optimized to make it more suitable for different products and market environments. At the same time, strict money management is also essential to control the proportion of single stop loss to avoid huge losses.
- ADX Parameters can test results of different cycles.
- Box parameters can test different lengths to determine optimal range sizes.
- Fine-tune stop loss and take profit coefficients to optimize risk-return ratios.
- Test the effects of unilateral long/short trading only.
- Add other indicators for combos, like volume indicators.
The ADX Intelligent Trend Tracking Strategy is generally a relatively stable trend tracking strategy. It combines trend strength judgment and price breakthrough signals to avoid the issues like chasing highs and killing lows that are common in typical trend following strategies. Through parameter optimization and strict money management, the strategy can profit steadily.
[/trans]
Strategy Arguments
| Argument | Default | Description |
|---|---|---|
| v_input_1 | 14 | (?ADX Settings)ADX Smoothing Period |
| v_input_2 | 14 | ADX Period |
| v_input_3 | 18 | ADX Lower Level |
| v_input_4 | 20 | (?BreakoutBox)BreakoutBox Lookback Period |
| v_input_5 | true | (?Take Profit and Stop Loss)Profit Target Box Width Multiple |
| v_input_6 | 0.5 | Stop Loss Box Width Multiple |
| v_input_7 | false | (?Trade Direction)Both(0), Long(1), Short(-1) |
Source (PineScript)
/*backtest
start: 2023-11-20 00:00:00
end: 2023-11-27 00:00:00
period: 5m
basePeriod: 1m
exchanges: [{"eid":"Futures_Binance","currency":"BTC_USDT"}]
*/

//Developer: Andrew Palladino.
//Creator: Rob Booker.
//Date: 9/29/2017
//@version=5
//Date: 08/10/2022
//Updated to V5 from V1, default cash settings added and indicators made more easily visible by:
// @ Powerscooter

strategy("Rob Booker - ADX Breakout", shorttitle="ADX Breakout V5", overlay=true, default_qty_type = strategy.cash, default_qty_value = 100000, initial_capital = 100000)

adxSmoothPeriod = input(14, title="ADX Smoothing Period", group = "ADX Settings")
adxPeriod = input(14, title="ADX Period", group = "ADX Settings")
adxLowerLevel = input(18, title="ADX Lower Level", group = "ADX Settings")
boxLookBack = input(20, title="BreakoutBox Lookback Period", group = "BreakoutBox")
profitTargetMultiple = input(1.0, title="Profit Target Box Width Multiple", group = "Take Profit and Stop Loss")
stopLossMultiple = input(0.5, title="Stop Loss Box Width Multiple", group = "Take Profit and Stop Loss")
enableDirection = input(0, title="Both(0), Long(1), Short(-1)", group = "Trade Direction")


// When the ADX drops below threshold limit, then we consider the pair in consolidation.
// Set Box around highs and lows of the last 20 candles. with upper and lower boundaries.
// When price breaks outside of box, a trade is taken. (on close or on touch?)
// Stop is placed, default 50%, of the size of the box. So if box is 200 pips, stop is at 100 pips.
// Profit target is 100% of the size of the box. Default. User can set a profit target of 0.5, 1 full size, 2 or 3.


dirmov(len) =>
	up = ta.change(high)
	down = -ta.change(low)
	truerange = ta.rma(ta.tr, len)
	plus = fixnan(100 * ta.rma(up > down and up > 0 ? up : 0, len) / truerange)
	minus = fixnan(100 * ta.rma(down > up and down > 0 ? down : 0, len) / truerange)
	[plus, minus]

adx(dilen, adxlen) =>
	[plus, minus] = dirmov(dilen)
	sum = plus + minus
	adx = 100 * ta.rma(math.abs(plus - minus) / (sum == 0 ? 1 : sum), adxlen)

adxHigh(dilen, adxlen) =>
	[plus, minus] = dirmov(dilen)
	plus

adxLow(dilen, adxlen) =>
	[plus, minus] = dirmov(dilen)
	minus

sig = adx(adxSmoothPeriod, adxPeriod)
//sigHigh = adxHigh(dilen, adxlen)
//sigLow = adxLow(dilen, adxlen)

isADXLow = sig < adxLowerLevel

//boxUpperLevel = ta.highest(high, boxLookBack)[1]
//boxLowerLevel = ta.lowest(low, boxLookBack)[1]

var float boxUpperLevelCarry = 0
var float boxLowerLevelCarry = 0

boxUpperLevel = strategy.position_size == 0 ? ta.highest(high, boxLookBack)[1] : boxUpperLevelCarry
boxUpperLevelCarry := boxUpperLevel
boxLowerLevel = strategy.position_size == 0 ? ta.lowest(low, boxLookBack)[1] : boxLowerLevelCarry
boxLowerLevelCarry := boxLowerLevel

boxWidth = boxUpperLevel - boxLowerLevel

profitTarget = strategy.position_size > 0  ? strategy.position_avg_price + profitTargetMultiple*boxWidth : strategy.position_size < 0 ?  strategy.position_avg_price - profitTargetMultiple*boxWidth : na
stopLoss = strategy.position_size > 0 ? strategy.position_avg_price - stopLossMultiple*boxWidth : strategy.position_size < 0 ? strategy.position_avg_price + stopLossMultiple*boxWidth : na

plot(strategy.position_size == 0 ? boxUpperLevel : na, color=color.white, style = plot.style_linebr)
plot(strategy.position_size == 0 ? boxLowerLevel : na, color=color.white, style = plot.style_linebr)


bgcolor(isADXLow ? color.purple : na, transp=72, title = "ADX limit")
plot(stopLoss, color=color.red, linewidth=2, style = plot.style_linebr, title="StopLossLine")
plot(profitTarget, color=color.blue, linewidth=2, style = plot.style_linebr, title="ProfitTargetLine")

isBuyValid = strategy.position_size == 0 and ta.cross(close, boxUpperLevel) and isADXLow

//Long Entry Condition
strategy.exit("close_long", from_entry="open_long", limit = profitTarget, stop = stopLoss)
if isBuyValid and strategy.opentrades == 0 and (enableDirection == -1 or enableDirection == 0)
    strategy.entry("open_long", strategy.long)

isSellValid = strategy.position_size == 0 and ta.cross(close, boxLowerLevel) and isADXLow

//Short Entry condition
strategy.exit(id="close_short", from_entry="open_short", limit = profitTarget, stop = stopLoss)
if isSellValid and strategy.opentrades == 0 and (enableDirection == 1 or enableDirection == 0)
    strategy.entry("open_short", strategy.short)
Detail
https://www.fmz.com/strategy/433545
Last Modified
2023-11-28 14:04:00