Name
3EMA-Boullinger-PIVOT
Author
ChaoZhang
Strategy Description
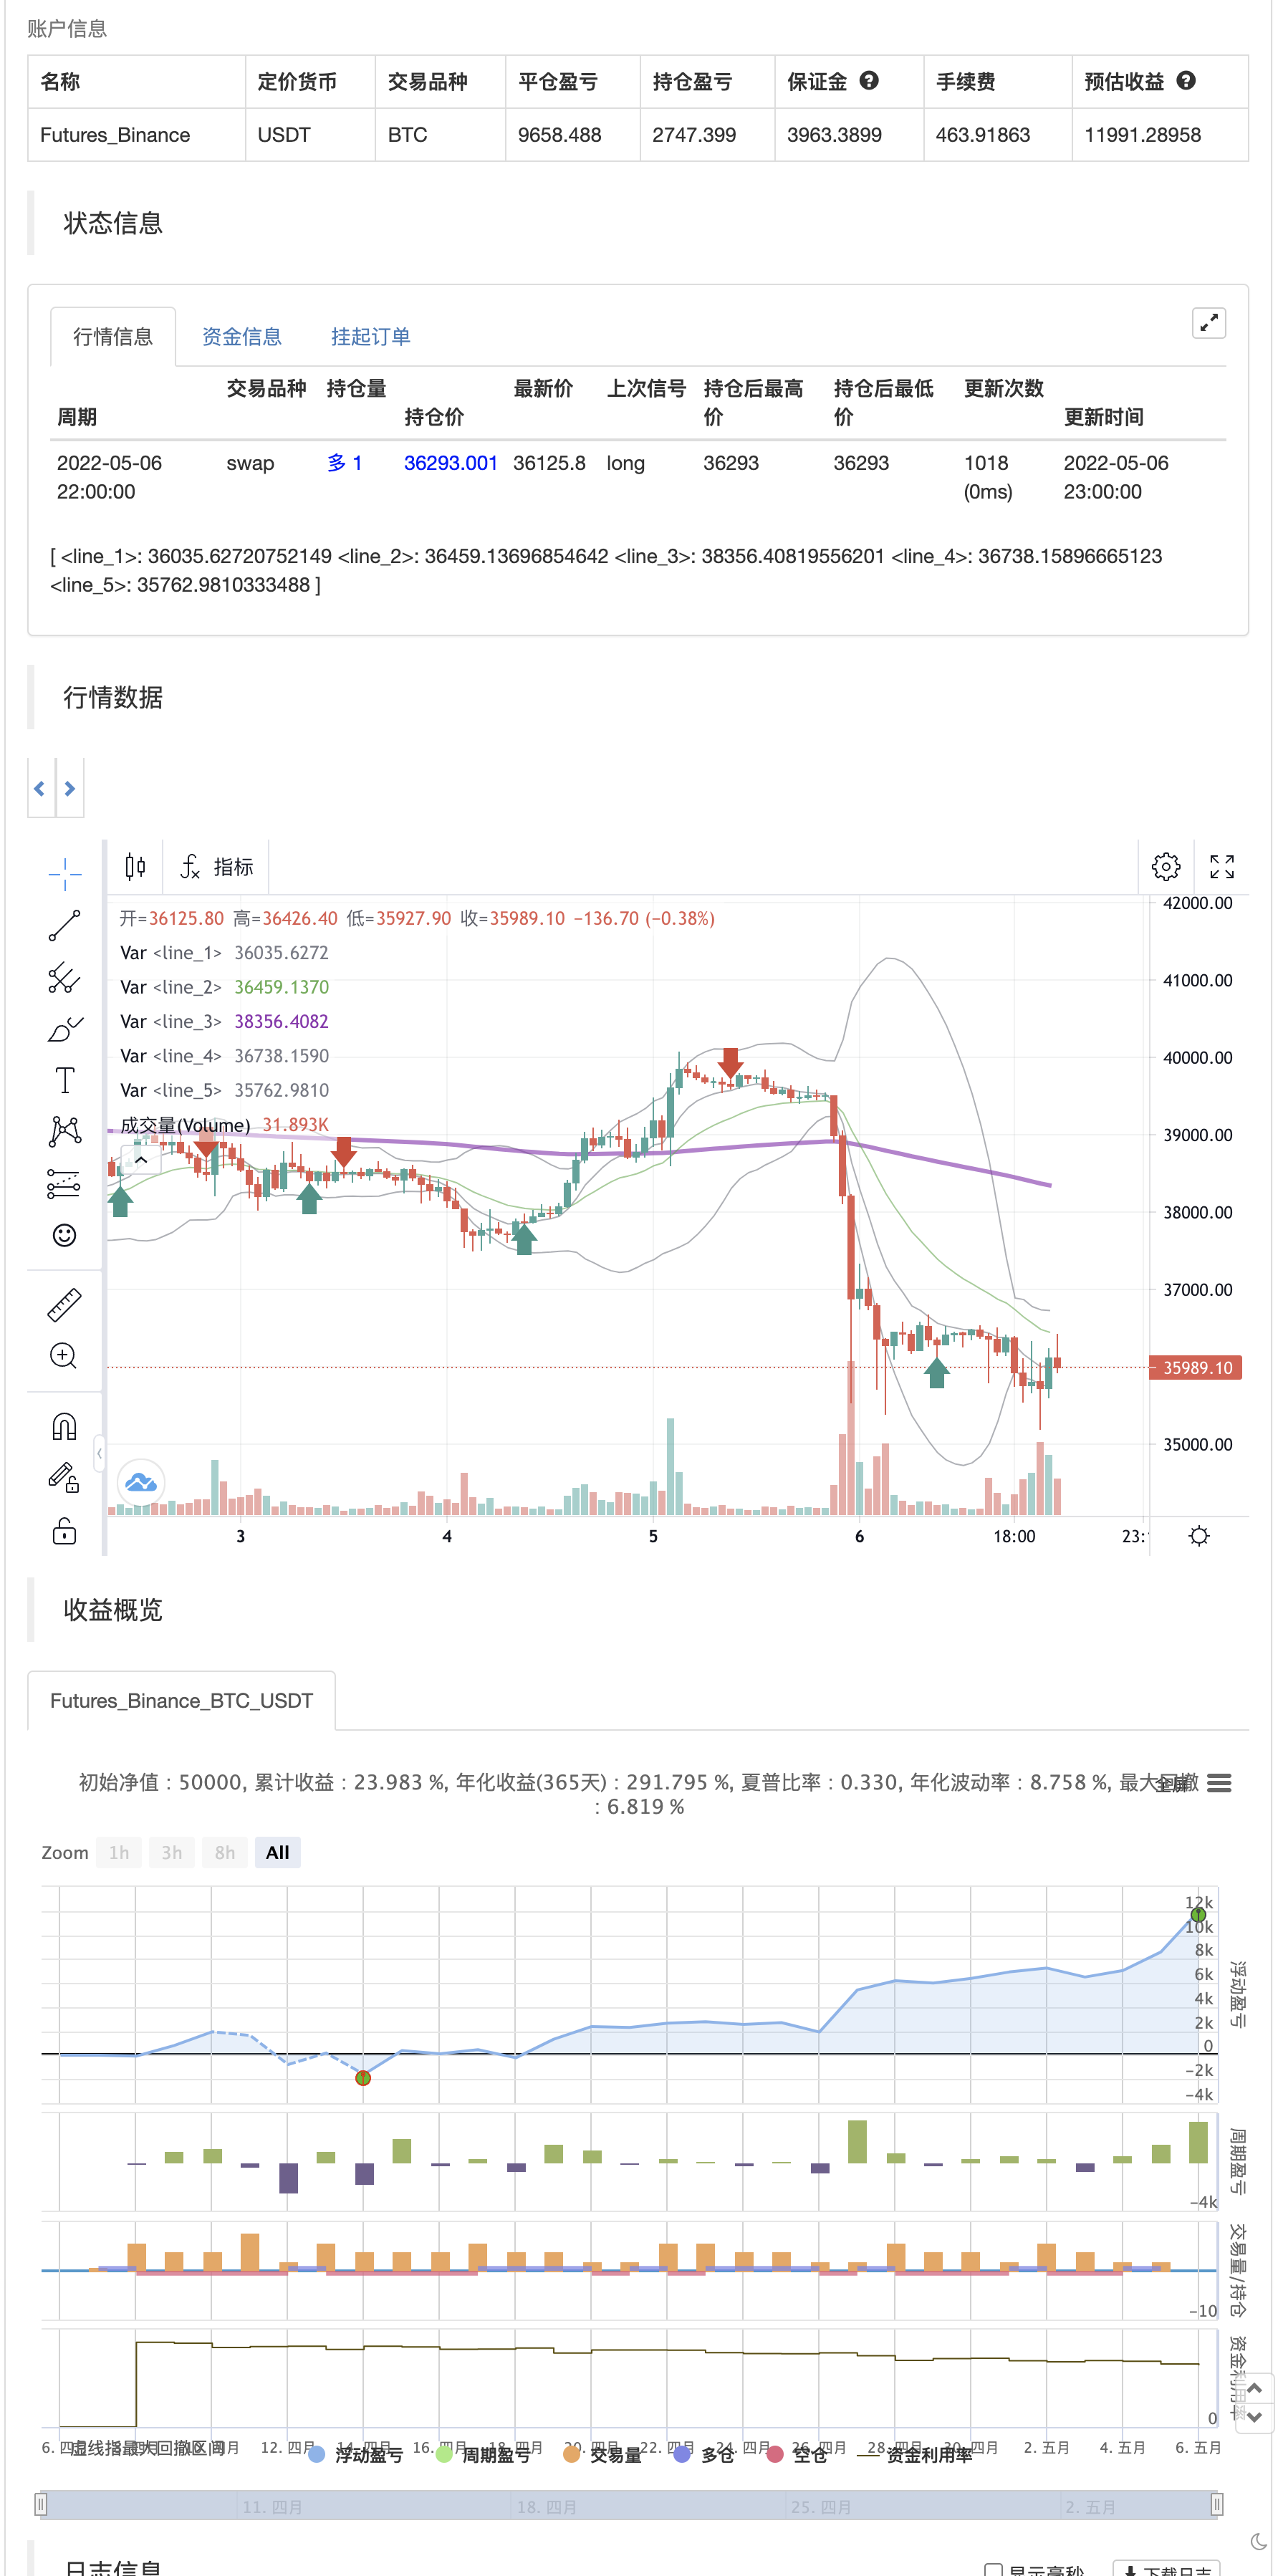
THREE EMAS + BOLLINGER BANDS + PIVOT
INDICATOR 1: THREE EMAS ( EXPONENTIAL MOVING AVERAGE ) With this indicator you can visualize the average of prices with greater weight to the most recent data. Three exponential moving averages are calculated and drawn: 4, 20 and 200 last candles. -Fast EMA1 = 8 -Average EMA2 = 20 -Slow EMA 3 = 200
INDICATOR 2: BOLLINGER BANDS With this indicator you can see the strength and trend of the market, that is, it is measured by the volatility of the asset price. If the price goes above the upper band, the asset is overbought. If the price goes above the lower band, the asset is oversold. Trend length - BASE = 20, step = 1 Standard Deviation - Multiplier = 2, step = 0.2
INDICATOR 3: PIVOT This indicator labels the points where the price is minimum and maximum, in a range of candles determined in the parameter "Distance to Pivot".
These 3 indicators are used for all types of assets: FOREX, CRYPT, CFD's, ETC.
backtest
Strategy Arguments
| Argument | Default | Description |
|---|---|---|
| v_input_1 | 8 | Periodo 1, Length 1= |
| v_input_2 | 20 | Periodo 2, Length 2= |
| v_input_3 | 200 | Periodo 3, Length 3= |
| v_input_4 | 20 | longitudBB, LenghtBB= |
| v_input_5 | 2 | Multiplicadorbb, EstDesv = |
| v_input_6_close | 0 | fuente: close |
| v_input_7 | 6 | distancia para el pivote/ distance to pivot |
Source (PineScript)
/*backtest
start: 2022-04-07 00:00:00
end: 2022-05-06 23:59:00
period: 1h
basePeriod: 15m
exchanges: [{"eid":"Futures_Binance","currency":"BTC_USDT"}]
*/

// This source code is subject to the terms of the Mozilla Public License 2.0 at https://mozilla.org/MPL/2.0/
// © JCMR76

//@version=4
study("3EMA + Boullinger + PIVOT", overlay=true)


// TRES EMAS - THREE EMA´s
periodo1 = input(8, title="Periodo 1, Length 1=", step =1, minval=1, maxval=300)
periodo2 = input(20, title="Periodo 2, Length 2=", step =1, minval=1, maxval=300)
periodo3 = input(200, title="Periodo 3, Length 3=", step =1, minval=1, maxval=1000)


plot(ema(close,periodo1), color=color.gray, linewidth=1)
plot(ema(close,periodo2), color=color.green, linewidth=1)
plot(ema(close,periodo3), color=color.purple, linewidth=3)

//BANDA BOLLINGER - BANDS BOLLINGER
longitudbb   = input(20,title = "longitudBB, LenghtBB=", type = input.integer, step = 1, minval=1, maxval=50)
multbb       = input(2.0, title = "Multiplicadorbb, EstDesv = ", type= input.float, step = 0.2, minval=0.2, maxval=20)
fuente       = input(close, title="fuente", type=input.source)
[mm,banda_sup, banda_inf] = bb(fuente, longitudbb,multbb)
ps=plot(banda_sup, color=color.new(color.gray, 90))
pi=plot(banda_inf, color=color.new(color.gray, 90))
//fill(ps,pi,color=color.new(color.gray,80))

//PIVOT - PIVOTE
dist = input(6, title ="distancia para el pivote/ distance to pivot ", type = input.integer, step = 1)

pl = pivotlow(low, dist, dist)
if not na(pl)
    strategy.entry("Enter Long", strategy.long)

ph = pivothigh(high, dist, dist)
if not na(ph)
    strategy.entry("Enter Short", strategy.short)
//PIVOT - PIVOTE
Detail
https://www.fmz.com/strategy/361802
Last Modified
2022-05-08 12:29:27