Name
3-10震荡器轮廓标记策略3-10-Oscillator-Profile-Flagging-Strategy
Author
ChaoZhang
Strategy Description
3 10震荡器轮廓标记策略通过计算3日和10日简单移动平均线之间的差值作为MACD指标,结合成交量的分析来判断市场买卖盘的强弱,从而产生交易信号。该策略同时结合关键价格区域、成交量特征以及MACD指标的反转来确认进场和出场机会。
该策略的核心指标是MACD,它由一个快速移动平均线和一个慢速移动平均线组成。快速线是3日简单移动平均线,慢速线是10日简单移动平均线。它们之间的差值构成MACD柱状线。当快速线从下方向上突破慢速线时,代表买盘力量加强,产生买入信号;反之快速线从上方向下跌破慢速线时,卖盘力量加强,产生卖出信号。
另外,该策略结合每根K线的买入成交量和卖出成交量的大小关系,判断市场买卖盘的相对强弱。具体方法是:买入成交量 = 成交量 x (收盘价-最低价)÷(最高价-最低价);卖出成交量 = 成交量 x (最高价-收盘价)÷(最高价-最低价)。如果买入成交量显著大于卖出成交量,说明该根K线以较强的买盘结束,这是一个买入信号。
通过组合MACD指标和成交量分析,该策略可以有效判断市场的供需关系和蓄势 pending 方向。同时,策略还会验证价位是否处于关键区域、MACD是否有效反转以及买卖盘成交量差异是否够大等条件,从而过滤掉一些冲动操作的噪音,确保高概率和高效率的入场。
- 利用MACD指标判断市场蓄势方向
- 成交量差异分析判断买卖盘强弱
- 多重条件筛选,确保高概率操作
- 采用止盈止损策略,控制风险
该策略最大的优势在于充分结合市场供需关系的判断。MACD柱状线可有效判断买卖盘力量对比和市场蓄势方向;成交量差异分析可清楚辨别买卖盘的主导力量。同时策略设置多重条件进行审核,避免追涨杀跌,确保获利概率较高。此外,策略内置止盈止损机制也可限制单笔损失。
- MACD失效风险。当市场震荡或持平盘整理时,MACD可能会产生虚假信号。
- 成交量失效风险。市场可能存在拉抬成交量的现象,这时成交量分析的准确性会降低。
- 参数优化难度大。该策略包含多个参数,优化难度较大,不适合参数调整能力较弱的投资者。
上述风险可通过以下方法加以规避:准确判断市场主要趋势,避免在震荡盘中使用该策略;关注市场信息面,识别成交量被人为拉抬的情况;调整参数要慎重,可借鉴专业机构的建议。
该策略可从以下几个方面进行优化:
- 利用KD、布林带等指标替代或配合MACD,提高判断准确性
- 增加仓位管理机制,让策略参数动态调整
- 优化止盈止损点,实现更高的单笔盈利
- 在多时间周期运行,提高稳定性
综上,可见本策略优化空间较大,投资者可根据自身情况和市场环境进行适当调整与改进,使策略效果更佳。
3 10震荡器轮廓标记策略成功融合了MACD分析、成交量比较以及多重条件过滤验证的思路。它判断供需关系和市场蓄势方向的能力较强,同时内置止盈止损机制控制风险。该策略优化空间大、应用前景广阔,值得投资者重点考虑和深入研究。
||
The 3 10 Oscillator Profile Flagging strategy generates trading signals by calculating the difference between 3-day and 10-day simple moving averages as the MACD indicator and combining volume analysis to determine the strength of buyers and sellers in the market. The strategy also incorporates confirmation of entry and exit opportunities using key price areas, volume characteristics, and MACD indicator reversals.
The core indicator of this strategy is MACD, which consists of a fast moving average line and a slow moving average line. The fast line is a 3-day simple moving average and the slow line is a 10-day simple moving average. The difference between them forms the MACD histogram. When the fast line crosses above the slow line from below, it represents strengthening buying power and generates a buy signal. Conversely, when the fast line crosses below the slow line from above, selling power is strengthening and a sell signal is generated.
In addition, the strategy incorporates analysis of the relative strength of buying and selling volume based on the size relationship between buying volume and selling volume of each candlestick. The specific method is: Buying volume = Volume x (Close - Low) ÷ (High - Low); Selling volume = Volume x (High - Close) ÷ (High - Low). If the buying volume is significantly greater than the selling volume, it means the candlestick closes with relatively strong buying power, which is a buy signal.
By combining the MACD indicator and volume analysis, the strategy can effectively determine the supply and demand relationship and the pending direction in the market. At the same time, the strategy also verifies conditions such as whether the price is in a key area, whether the MACD has an effective reversal, and whether the difference between buying and selling volume is large enough, so as to filter out some impulsive noise and ensure high-probability and high-efficiency entry.
- Use MACD indicator to judge market pending direction
- Volume difference analysis to determine the strength of buyers and sellers
- Multi-condition screening ensures high-probability operation
- Adopt stop profit and stop loss strategy to control risks
The biggest advantage of this strategy is that it fully incorporates judgment of market supply and demand relationship. The MACD histogram can effectively determine the contrast between buying and selling power and the pending direction in the market; volume difference analysis can clearly identify the dominant power between buyers and sellers. At the same time, the strategy sets multiple conditions for review to avoid chasing rises and beating declines, ensuring a relatively high probability of profit. In addition, the built-in stop profit and stop loss mechanism of the strategy can also limit single losses.
- MACD failure risk. When the market fluctuates or consolidates in a flat pattern, the MACD may generate false signals.
- Volume failure risk. There may be market manipulation to drive up trading volume, which would reduce the accuracy of volume analysis.
- Difficulty of parameter optimization. The strategy contains multiple parameters that are difficult to optimize, making it unsuitable for investors with relatively weak parameter tuning capabilities.
The above risks can be avoided by: accurately determining the main trend of the market to avoid using this strategy during market fluctuation; paying attention to market information to identify artificially inflated trading volumes; adjusting parameters carefully, or seeking advice from professionals.
The strategy can be optimized in the following aspects:
- Use indicators like KD, Bollinger Bands etc. to replace or assist MACD and improve judgment accuracy
- Add position management mechanisms for dynamic parameter adjustment
- Optimize stop profit and stop loss points for higher single profit
- Run on multiple timeframes to improve stability
In summary, it can be seen that there is ample room for optimizing this strategy. Investors can make appropriate adjustments and improvements according to their own situation and market conditions to achieve better strategy effectiveness.
The 3 10 Oscillator Profile Flagging strategy successfully integrates the ideas of MACD analysis, volume comparison, and multi-condition filtering verification. It has strong capabilities in determining supply-demand relationships and market pending directions, while controlling risks through built-in stop profit and stop loss mechanisms. The strategy has large optimization space and broad application prospects that are worth key consideration and in-depth research for investors.
[/trans]
Strategy Arguments
| Argument | Default | Description |
|---|---|---|
| v_input_1 | 0.26 | Signal Bias |
| v_input_2 | 0.8 | MACD Bias |
| v_input_3 | 3 | Short LookBack |
| v_input_4 | 10 | Long LookBack |
| v_input_5 | 0.75 | Take Profit |
| v_input_6 | 0.5 | Stop Loss |
Source (PineScript)
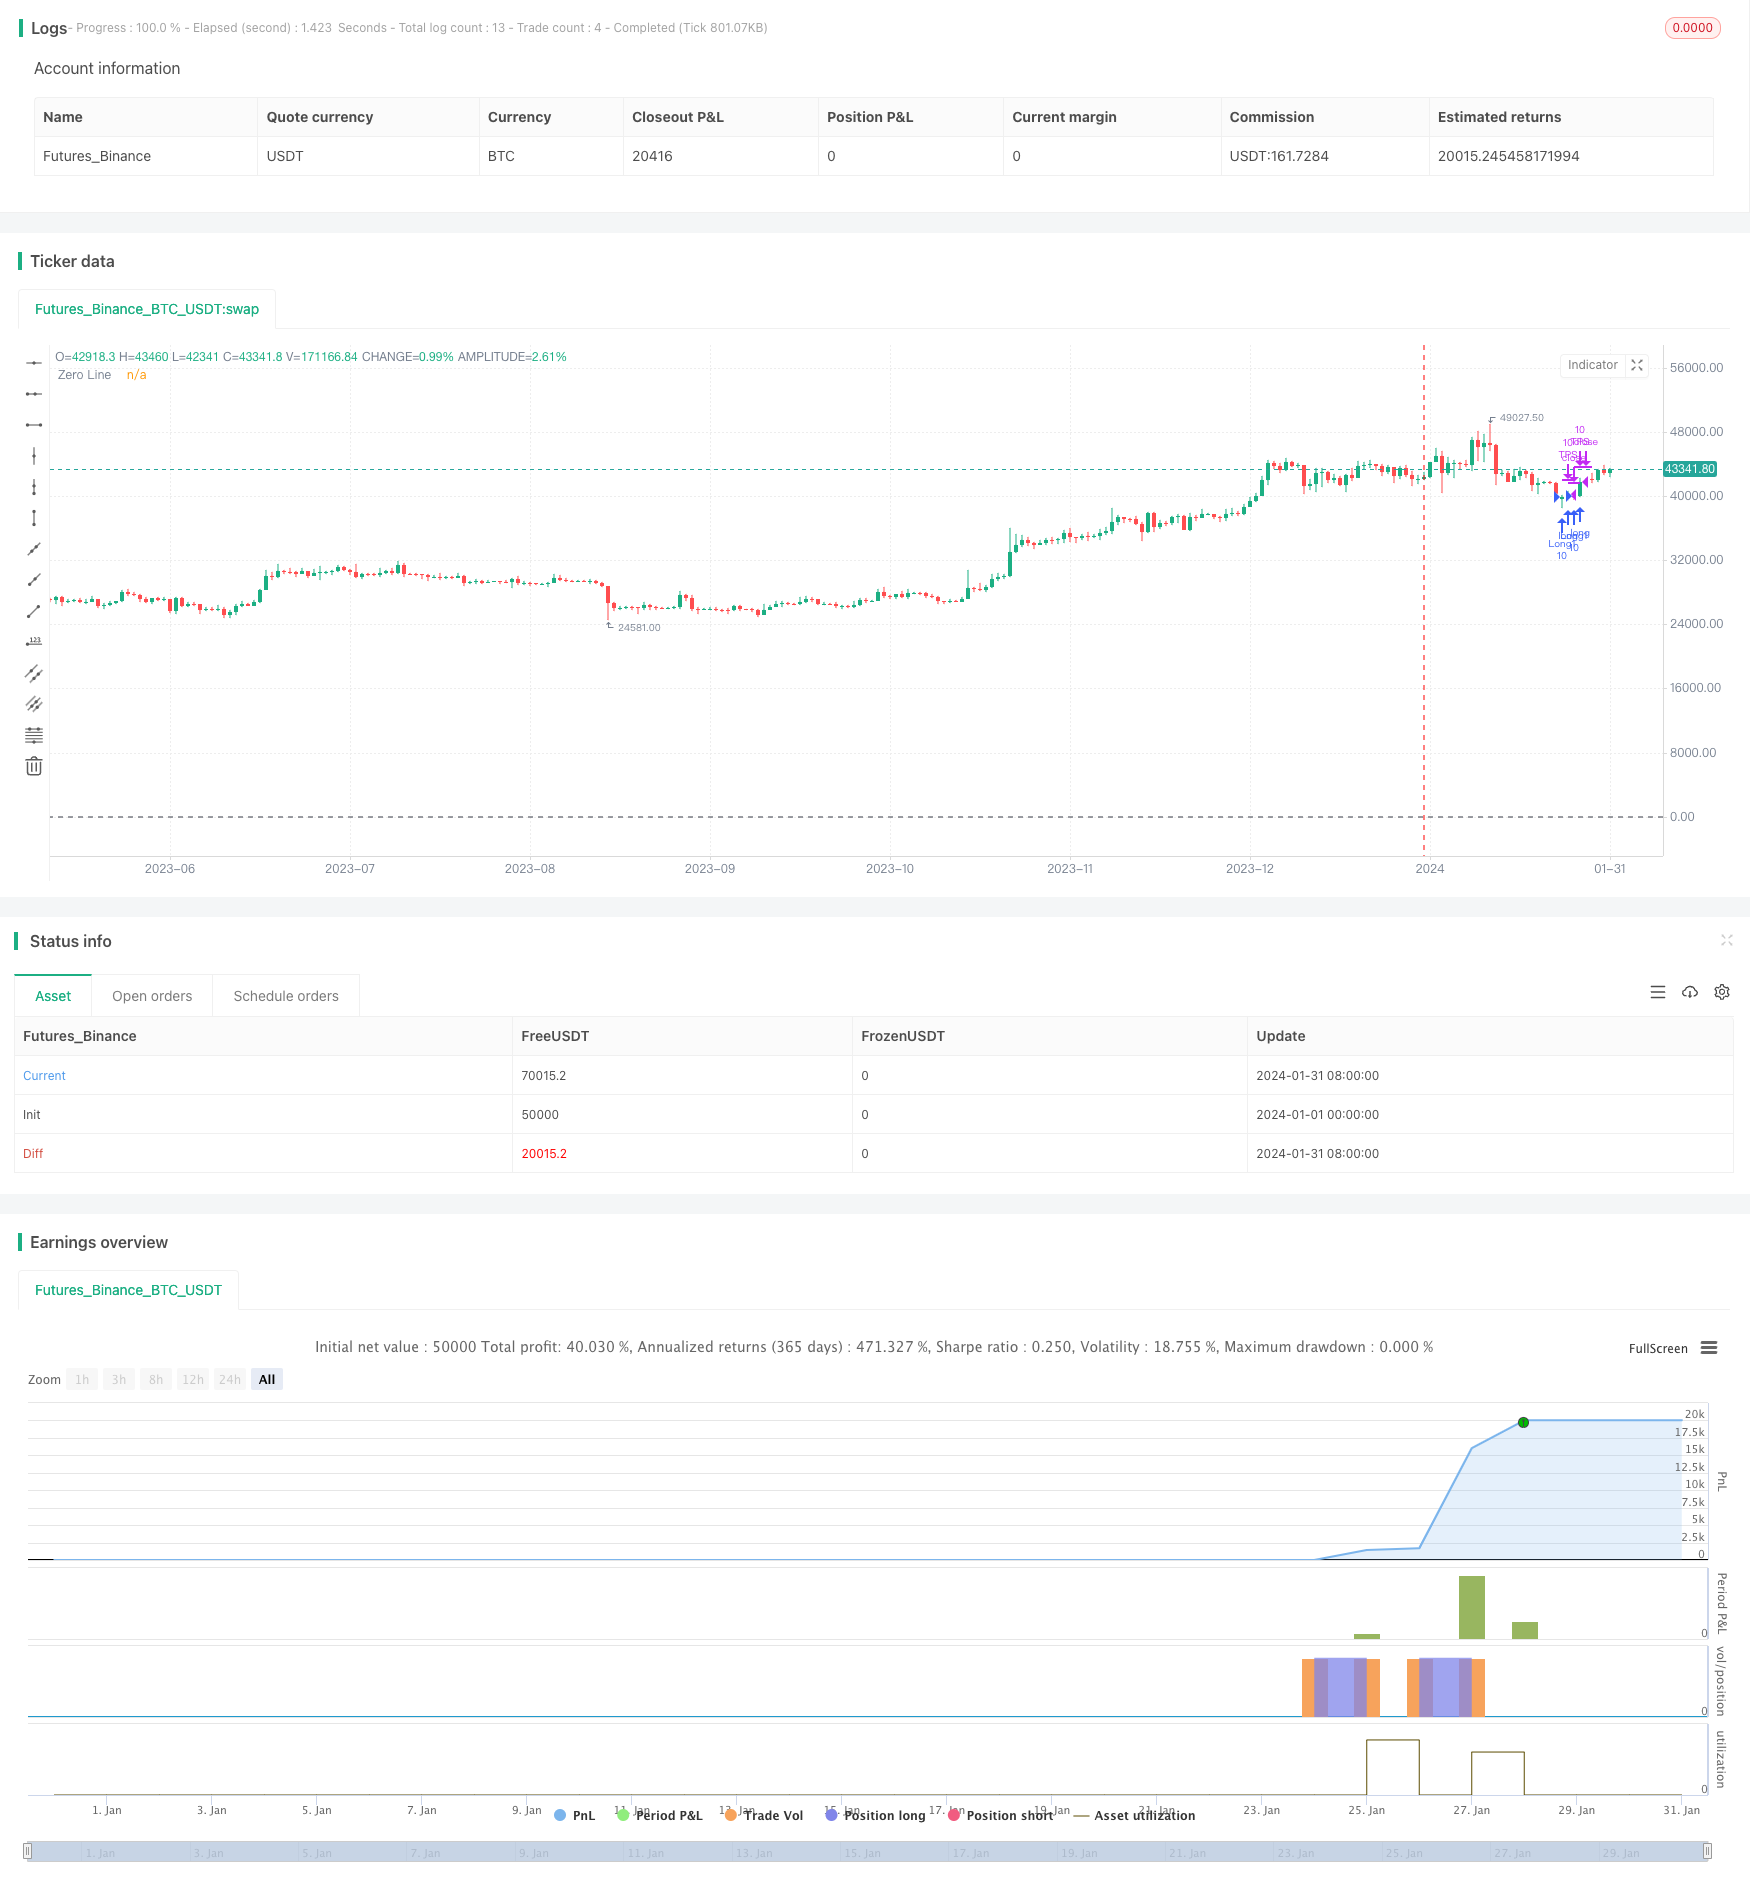
/*backtest
start: 2024-01-01 00:00:00
end: 2024-01-31 23:59:59
period: 1d
basePeriod: 1h
exchanges: [{"eid":"Futures_Binance","currency":"BTC_USDT"}]
*/

//@version=5
strategy("3 10 Oscillator Profile Flagging", shorttitle="3 10 Oscillator Profile Flagging", overlay=true)

signalBiasValue = input(title="Signal Bias", defval=0.26)
macdBiasValue = input(title="MACD Bias", defval=0.8)
shortLookBack = input( title="Short LookBack", defval=3)
longLookBack = input( title="Long LookBack", defval=10)
takeProfit = input( title="Take Profit", defval=0.75)
stopLoss = input( title="Stop Loss", defval=0.5)

fast_ma = ta.sma(close, 3)
slow_ma = ta.sma(close, 10)
macd = fast_ma - slow_ma
signal = ta.sma(macd, 16)
hline(0, "Zero Line", color = color.black)

buyVolume = volume*((close-low)/(high-low))
sellVolume = volume*((high-close)/(high-low))
buyVolSlope = buyVolume - buyVolume[1]
sellVolSlope = sellVolume - sellVolume[1]
signalSlope = ( signal - signal[1] )
macdSlope = ( macd - macd[1] )
//plot(macdSlope, color=color.red, title="Total Volume")
//plot(signalSlope, color=color.green, title="Total Volume")
intrabarRange = high - low

getLookBackSlope(lookBack) => signal - signal[lookBack]
getBuyerVolBias(lookBack) =>
    j = 0
    for i = 1 to lookBack
        if buyVolume[i] > sellVolume[i]
            j += 1
    j

getSellerVolBias(lookBack) =>
    j = 0
    for i = 1 to lookBack
        if sellVolume[i] > buyVolume[i]
            j += 1
    j

getVolBias(lookBack) =>
    float b = 0
    float s = 0
    for i = 1 to lookBack
        b += buyVolume[i]
        s += sellVolume[i]
    b > s

getSignalBuyerBias(lookBack) =>
    j = 0
    for i = 1 to lookBack
        if signal[i] > signalBiasValue
            j += 1
    j

getSignalSellerBias(lookBack) =>
    j = 0
    for i = 1 to lookBack
        if signal[i] < ( 0 - signalBiasValue )
            j += 1
    j

getSignalNoBias(lookBack) =>
    j = 0
    for i = 1 to lookBack
        if signal[i] < signalBiasValue and signal[i] > ( 0 - signalBiasValue )
            j += 1
    j

getPriceRising(lookBack) =>
    j = 0
    for i = 1 to lookBack
        if close[i] > close[i + 1]
            j += 1
    j


getPriceFalling(lookBack) =>
    j = 0
    for i = 1 to lookBack
        if close[i] < close[i + 1]
            j += 1
    j

getRangeNarrowing(lookBack) =>
    j = 0
    for i = 1 to lookBack
        if intrabarRange[i] < intrabarRange[i + 1]
            j+= 1
    j

getRangeBroadening(lookBack) =>
    j = 0
    for i = 1 to lookBack
        if intrabarRange[i] > intrabarRange[i + 1]
            j+= 1
    j

bool isNegativeSignalReversal = signalSlope < 0 and signalSlope[1] > 0
bool isNegativeMacdReversal = macdSlope < 0 and macdSlope[1] > 0

bool isPositiveSignalReversal = signalSlope > 0 and signalSlope[1] < 0
bool isPositiveMacdReversal = macdSlope > 0 and macdSlope[1] < 0

bool hasBearInversion = signalSlope > 0 and macdSlope < 0
bool hasBullInversion = signalSlope < 0 and macdSlope > 0

bool hasSignalBias = math.abs(signal) >= signalBiasValue
bool hasNoSignalBias = signal < signalBiasValue and signal > ( 0 - signalBiasValue )

bool hasSignalBuyerBias = hasSignalBias and signal > 0
bool hasSignalSellerBias = hasSignalBias and signal < 0

bool hasPositiveMACDBias = macd > macdBiasValue
bool hasNegativeMACDBias = macd < ( 0 - macdBiasValue )

bool hasBullAntiPattern = ta.crossunder(macd, signal)
bool hasBearAntiPattern = ta.crossover(macd, signal)

bool hasSignificantBuyerVolBias = buyVolume > ( sellVolume * 1.5 )
bool hasSignificantSellerVolBias = sellVolume > ( buyVolume * 1.5 )

// 7.48 Profit 52.5%
if ( hasSignificantBuyerVolBias and getPriceRising(shortLookBack) == shortLookBack  and getBuyerVolBias(shortLookBack) == shortLookBack and hasPositiveMACDBias and hasBullInversion)
    strategy.entry("Short1", strategy.short, qty=10)
strategy.exit("TPS", "Short1", limit=strategy.position_avg_price - takeProfit, stop=strategy.position_avg_price + stopLoss)

// 32.53 Profit 47.91%
if ( getPriceFalling(shortLookBack) and (getVolBias(shortLookBack) == false) and signalSlope < 0 and hasSignalSellerBias)
    strategy.entry("Long1", strategy.long, qty=10)
strategy.exit("TPS", "Long1", limit=strategy.position_avg_price + takeProfit, stop=strategy.position_avg_price - stopLoss)
Detail
https://www.fmz.com/strategy/442016
Last Modified
2024-02-18 16:17:26