Name
20水平突破策略20-Level-Breakout-Strategy
Author
ChaoZhang
Strategy Description
20水平突破策略是一种趋势追踪策略。它的核心思想是,当价格突破某一关键水平时,表明趋势发生反转,这时可以根据突破的方向建立做多或做空仓位。
本策略选择20日均线作为关键水平。当收盘价从上方突破20日均线时,做多;当收盘价从下方突破20日均线时,做空。
20水平突破策略使用20日均线作为判断趋势突破的标准。当价格从上方向下突破20日均线时,表明行情处在下行趋势,这时做空;当价格从下方向上突破20日均线时,表明行情处在上行趋势,这时做多。
该策略同时结合MACD指标判定行情。只有当MACD为红柱时才会发出做空信号;只有当MACD为绿柱时才会发出做多信号。这可以避免在盘整时产生错误信号。
具体来说,策略逻辑是:
- 定义20日均线为基准线;
- 当收盘价高于基准线+0.2%时且满足MACD条件时,在突破日的次日开盘价附近做多;
- 当收盘价低于基准线-0.2%时且满足MACD条件时,在突破日的次日开盘价附近做空;
- 做多止损为基准线下方0.5%,止盈为上方1%;
- 做空止损为基准线上方0.5%,止盈为下方1%。
通过这样的设定,本策略可以在趋势发生转换时及时捕捉机会,达到跟踪市场趋势的目的。
20水平突破策略具有以下优势:
-
操作简单,容易实施。20日均线的计算及判断规则非常简单直接。
-
回撤相对较小。采用价格突破作为建仓信号,可以有效避免无谓的反向操作。
-
跟踪趋势能力较强。20日均线可以很好地反映中短期趋势的转变。结合MACD指标进行过滤,避免了趋势震荡时错误建仓。
20水平突破策略也存在以下风险:
-
当价格出现剧烈波动时,20日均线方法将产生滞后,可能错过最佳入场时机。
-
在盘整行情下,价格可能出现频繁的上下突破。如果没有很好的指标过滤,将出现过多无效交易。
-
策略并没有考虑股价波动的幅度因素。如果不结合波动率指标,将面临亏损过大的风险。
-
固定的止损止盈位置也会影响策略的顺利进行。这需要根据不同标的调整参数。
20水平突破策略可从以下方面进行优化:
-
尝试不同的均线周期,如10日、30日等,看哪个周期能更好地把握趋势。
-
加入波动率指标,根据股价波动幅度动态调整仓位。这可以有效控制风险。
-
优化止损止盈位置。可以根据历史回测数据计算出最优参数。
-
尝试结合其它指标,如KDJ、布林线等进行ormapSignal滤。这可以减少无效交易。
-
开发改进版本,在更高的时间框架上寻找更大的趋势,然后在较低的时间框架上进行入场。
20水平突破策略通过价格突破判断趋势转折点,具有操作简单、跟踪趋势能力较强的优点。但也存在一些风险,需要进一步优化以适应市场的复杂性。总的来说,20水平突破策略作为一种较为基础的趋势追踪策略,仍有较大的改进空间。投资者可以在此基础上不断优化,使其能够在多种市场环境下获得稳定收益。
||
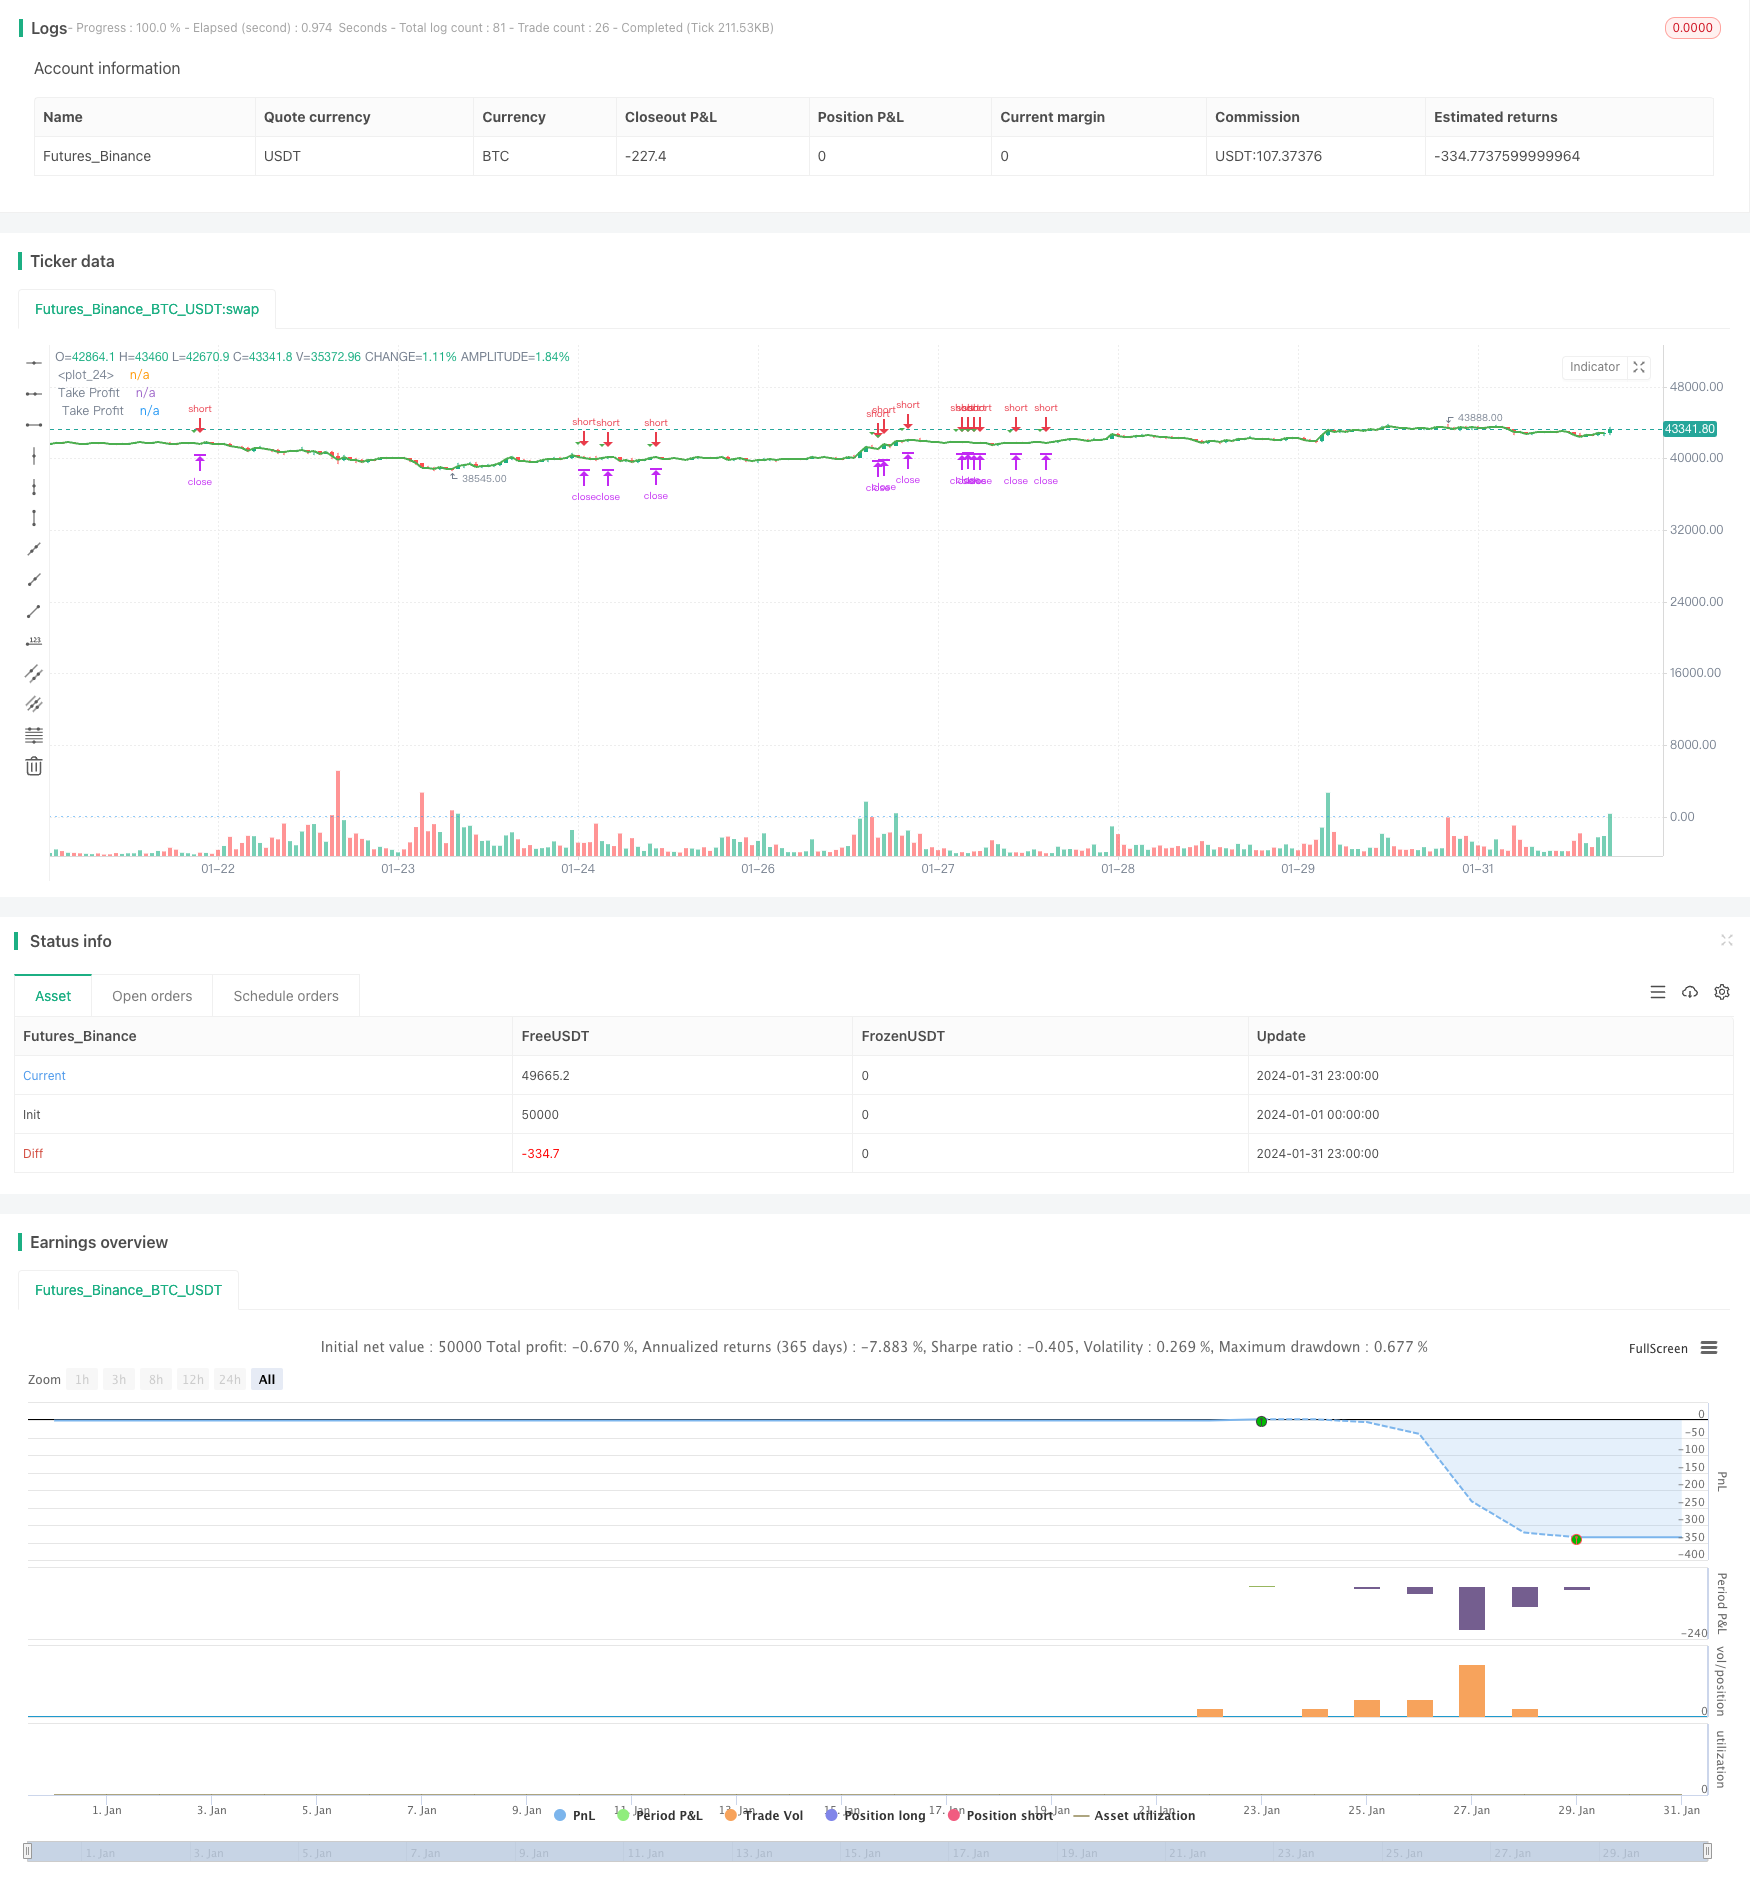
The 20 level breakout strategy is a trend following strategy. Its core idea is that when the price breaks through a certain key level, it indicates a trend reversal. At this point, long or short positions can be established according to the direction of the breakout.
This strategy chooses the 20-day moving average as the key level. When the closing price breaks through the 20-day moving average from above, go long; when the closing price breaks through the 20-day moving average from below, go short.
The 20 level breakout strategy uses the 20-day moving average to judge trend breakouts. When prices break through the 20-day moving average from top to bottom, it indicates a downward trend in the market, then we should go short. When prices break through the 20-day moving average from bottom to top, it indicates an upward trend in the market, then we should go long.
This strategy also incorporates the MACD indicator to determine market conditions. Short signals are only issued when the MACD is a red bar; Long signals are only issued when the MACD is a green bar. This avoids generating wrong signals during market consolidations.
Specifically, the strategy logic is:
- Define the 20-day moving average as the base line;
- When the closing price is higher than the base line +0.2% and the MACD condition is met, go long near the opening price on the day after the breakout;
- When the closing price is lower than the base line -0.2% and the MACD condition is met, go short near the opening price on the day after the breakout;
- Set stop loss at 0.5% below base line and take profit at 1% above base line for long positions;
- Set stop loss at 0.5% above base line and take profit at 1% below base line for short positions.
With this setup, this strategy can capture opportunities in time when trend transitions occur, achieving the goal of tracking market trends.
The 20 level breakout strategy has the following advantages:
-
Simple to implement. The calculation and judgment rules of 20-day moving average are very straightforward.
-
Relatively small drawdowns. Using price breakouts as trading signals can effectively avoid unnecessary reverse operations.
-
Strong trend tracking capability. The 20-day moving average can reflect changes in medium-term trends very well. Combining MACD filters avoids wrongly establishing positions during trend consolidations.
The 20 level breakout strategy also has the following risks:
-
When prices fluctuate violently, the 20-day moving average method will lag, possibly missing the best entry opportunity.
-
In range-bound markets, prices may break through up and down frequently. If there is no good indicator filter, there will be too many invalid trades.
-
The strategy does not consider the amplitude of price fluctuations. If volatility indicators are not combined, there is a risk of excessive losses.
-
Fixed stop loss and take profit levels will also affect the smooth operation of the strategy. This requires adjusting parameters according to different underlying assets.
The 20 level breakout strategy can be optimized in the following aspects:
-
Try moving averages with different periods, such as 10-day, 30-day, etc., to see which period can better grasp the trend.
-
Add volatility indicators to dynamically adjust positions based on the magnitude of price fluctuations. This can effectively control risks.
-
Optimize stop loss and take profit positions. The optimal parameters can be calculated from historical backtest data.
-
Try combining other indicators such as KDJ, Bollinger Bands, etc. for signal filtering. This can reduce invalid trades.
-
Develop improved versions by finding larger trends on higher time frames first, and then entering on lower time frames.
The 20 level breakout strategy identifies trend turning points through price breakouts. It has the advantages of simple operation and strong trend tracking capability. But there are still some risks that need further optimization to adapt to market complexity. Overall, the 20 level breakout strategy, as a relatively basic trend following strategy, still has considerable room for improvement. Investors can continue to optimize it so that it can achieve steady returns in various market environments.
[/trans]
Source (PineScript)
/*backtest
start: 2024-01-01 00:00:00
end: 2024-01-31 23:59:59
period: 1h
basePeriod: 15m
exchanges: [{"eid":"Futures_Binance","currency":"BTC_USDT"}]
*/

//@version=5


//@version=4
strategy("20 Level Breakout", overlay=true)

baseLevel = math.floor(close * 100) /100
eigthylevel = baseLevel - 0.002
twentyLevel = baseLevel + 0.002
takeprofitL = baseLevel - 0.01
stoplossL = baseLevel + 0.02
takeprofitS = baseLevel + 0.015
stoplossS = baseLevel - 0.02

isPriceAboveLevel(price, level) =>
    price > level

breakout = close > twentyLevel and close > baseLevel
breakoutl = close < eigthylevel and close < baseLevel
// Entry condition: Only enter if there are no open trades and the close is between baseLevel and baseLevel + 0.01
isLong = breakout and close > baseLevel and close <= (baseLevel + 0.01) and ta.rsi(close, 14) > 40 and ta.ema(close,50)<close
isShort = breakoutl and close < baseLevel and close >= (baseLevel - 0.01)
// Debugging
plot(isLong ? 1 : 0, color=color.blue, style=plot.style_histogram)
plotshape(isLong, style=shape.triangledown, color=color.green, size=size.small)
plotshape(isShort, style = shape.triangleup, color =  color.red, size = size.small)
// Plotting the stop loss line
plot(stoplossL, color=color.red, linewidth=2, title="Take Profit")
plot(stoplossS, color=color.green, linewidth = 2, title = " Take Profit")
strategy.entry("Short", strategy.short, when=isLong, stop =twentyLevel)
strategy.exit("Stop Loss/Profit", "Short", stop = stoplossL , limit = takeprofitL)

strategy.entry("Long",strategy.long, when=isShort , stop = eigthylevel )
strategy.exit("Stop loss/Profit", "Long", stop = stoplossS , limit = takeprofitS)
Detail
https://www.fmz.com/strategy/442868
Last Modified
2024-02-26 17:27:50